Analysis videos

- Page 2
Business Meeting in a Library
Digital Data Dashboard with Animated Charts and Graphs
PremiumPremium
Futuristic Digital Interface Scanning and Data Analysis Animation
PremiumPremium
A hand holds a magnifying glass over a screen with financial charts
PremiumPremiumGenerated by AI
Close-up angle of a computer screen displaying colorful financial graphs in a modern office
PremiumPremium
Data Chart Animated Loop Blue 01
Business Meeting and Financial Transaction
Digital Financial Data Visualization with Animated Charts and Graphs
PremiumPremium
Dynamic data visuals for business info graphics, animated charts, and data-driven insights for a business meeting mock-up. Explore the world of trading, stock exchanges, and crypto
PremiumPremium
Business Team Analyzing Financial Charts and Graphs in a Meeting
PremiumPremiumGenerated by AI
Advanced AI Analytics Dashboard Featuring Trend Metrics, Interactive Graphs, and Real-Time Data Visualizations for Insightful Decision-Making Processes
PremiumPremiumGenerated by AI
Financial data charts and graphs animation over world map and stock market data
PremiumPremium
Global Data Network Visualization
Data Chart Animated Loop Green 02
Analyzing Data Visualizations: A Focused Business Professional Engages with Graphs and Charts in a Modern Office Setting for Insightful Decision Making
PremiumPremiumGenerated by AI
Paperwork on office desk containing business financial information, close up
PremiumPremium
Business stock market, trading, info graphic with animated graphs, charts and data numbers insight analysis to be shown on monitor display screen for business meeting mock up theme
PremiumPremium
Focused Data Analyst Analyzing Complex Graphs and Visuals on a Computer Screen in a Modern Office Environment, Reflecting Critical Thinking and Insightful Decision-Making
PremiumPremiumGenerated by AI
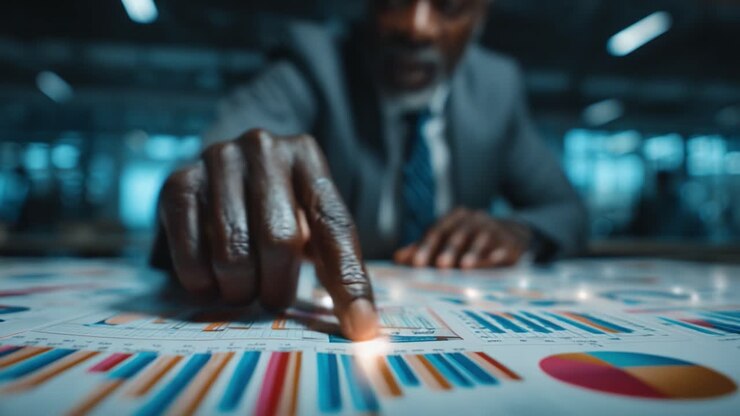
Analyzing Business Growth: A Close-Up on Statistical Data and Performance Indicators with a Focused Hand Gesture on Graphical Charts
PremiumPremiumGenerated by AI
Businesswoman Analyzing Financial Data
Person using digital tablet with pen for business analysis
PremiumPremium
Woman working on laptop in modern office
Business Meeting Presentation
Business Meeting in Progress
Businessman Working on Calculations in Office
Dynamic data visuals for business info graphics, animated charts, and data-driven insights for a business meeting mock-up
PremiumPremium
Business Data Concept Graphs With Alpha 02
Data Chart Growth Red 02
Data Chart Growth Chart Blue 02
Hands, business people in meeting
PremiumPremium
Displaying financial data analysis with graphs, charts, and network connections animation
PremiumPremiumGenerated by AI
Dynamic data visuals for business info graphics, animated charts, and data-driven insights for a business meeting mock-up. Explore the world of trading, stock exchanges, and crypto
PremiumPremium
Dynamic data visuals for business info graphics, animated charts, and data-driven insights for a business meeting mock-up. Explore the world of trading, stock exchanges, and crypto
PremiumPremium
Business Meeting in Progress
Charts and Graphs on a Wall
PremiumPremium
Business Team Meeting on the Floor
Close-up angle of a business professional analyzing charts and graphs, conveying a corporate
PremiumPremium
Data Chart Growth Chart Blue 01
Animation of digital data processing and text over grid on dark background
PremiumPremium
Financial Chart with Candlestick Graphs
Businesswoman Reviewing Graphs in a Meeting
Student Studying Late Night with Tablet and Books
PremiumPremium
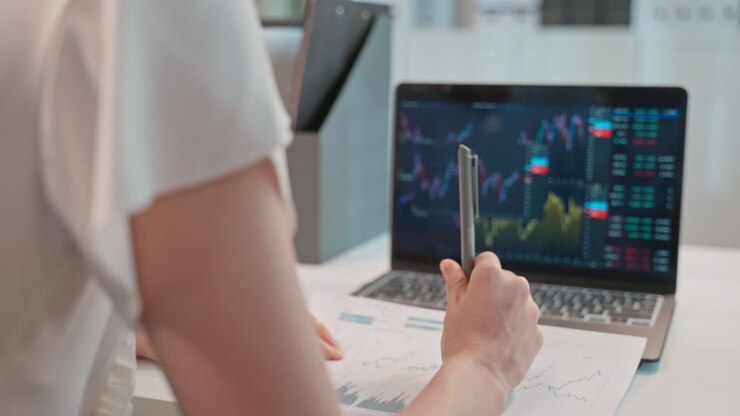
A Focused Analysis on Data Trends: An Individual Utilizing a Pen to Annotate Graphs and Charts in a Professional Workspace, Capturing Key Insights from Reports
PremiumPremiumGenerated by AI
Digital Financial Data Visualization with Charts and Graphs
PremiumPremium
Business Meeting in Progress
PremiumPremiumGenerated by AI
Senior Woman Lawyer Reviewing Documents in a Library Setting
Woman presenting data on a laptop in a business meeting
4k Data Analysis Animated Tag Word Cloud,Text Design big data Animation loop.
PremiumPremium
Vertical blue bars floating over translucent 3D grid, showing red and blue line graphs shifting
PremiumPremiumGenerated by AI
Hand touching a bar graph on a tablet
PremiumPremium