Analysis videos

- Page 6
Visualizing Data Trends: Advanced AI Analytics on a Dynamic Dashboard Showcasing Insights and Performance Metrics in Real-Time for Enhanced Decision-Making
PremiumPremiumGenerated by AI
Business Meeting and Presentation
Team Collaboration on Business Project Planning and Timeline
Dynamic data visuals for business info graphics, animated charts, and data-driven insights for a business meeting mock-up. Explore the world of trading, stock exchanges, and crypto
PremiumPremium
Business Meeting
Data Visualization Dashboard
PremiumPremium
Businessman Analyzing Financial Data and Charts with a Pen
PremiumPremiumGenerated by AI
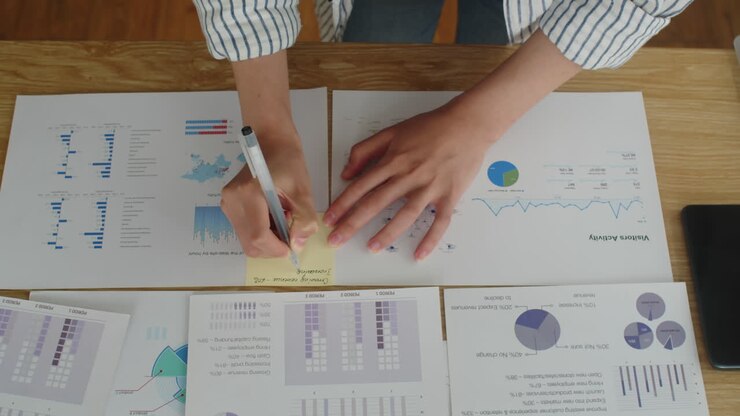
Analyzing Data: A Close-up View of Business Reports with Graphs and Charts, Highlighting Insights and Trends for Strategic Decision-Making
PremiumPremiumGenerated by AI
Business Meeting in Conference Room with Data Presentation
Diverse Business Team Collaborating and Discussing Ideas in an Office Meeting
Team collaboration on project analysis in a modern workspace setting
PremiumPremiumGenerated by AI
Diverse Business Team in a Collaborative Meeting with a Presentation
Montage of seo terms appearing with blue sparks
PremiumPremium
Animation of financial data processing over dark background
PremiumPremium
Business Team Analyzing Financial Charts and Data in Office Meeting
PremiumPremiumGenerated by AI
Smart transport technology alteration concept for future road traffic control
Dynamic data visuals for business info graphics, animated charts, and data-driven insights for a business meeting mock-up. Explore the world of trading, stock exchanges, and crypto
PremiumPremium
Visionary business dashboard for financial data analysis
PremiumPremium
Business Meeting in Office
Focused business woman working with documents at home office
Business Meeting Presentation
Teamwork are looking at a bunch of graphs and charts. One of the people is pointing at a chart.
PremiumPremiumGenerated by AI
Business and financial reports with charts displayed on a board
PremiumPremium
Dynamic data visuals for business info graphics, animated charts, and data-driven insights for a business meeting mock-up. Explore the world of trading, stock exchanges, and crypto
PremiumPremium
Male professional examining documents outside
Data Analysis and Management Process Timeline
Digital Business and Financial Data Analysis Dashboard
PremiumPremium
Financial Analytics Dashboard Displaying Stock Market Growth Charts on a Digital Screen
PremiumPremiumGenerated by AI
Business Person Analyzing Digital Data Chart on Tablet with Stylus
PremiumPremiumGenerated by AI
Person Analyzing Business Charts and Graphs
PremiumPremium
Using animation, digital interface displaying graphs, charts, and world map data
PremiumPremiumGenerated by AI
Business Meeting in Modern Office
Asian man oppening an envelope and reading content.
Manager Making Business Report on Table at Office
PremiumPremium
Patient getting swab testing for covid19 in hospital emergency unit closeup.
Comprehensive Overview of Advanced Data Analytics Dashboard Featuring AI Insights and Performance Metrics for Informed Decision-Making
PremiumPremiumGenerated by AI
Business professionals analyzing data on a tablet
PremiumPremium
Business team collaborating on data analysis with charts and documents
Business Colleagues in Meeting
Infographics and Charts Presentation
Scientific Futuristic Data Dashboard With Charts And Monitoring Panels Display
PremiumPremiumGenerated by AI
Close-up angle of a hand using a stylus on a tablet displaying colorful charts, conveying a modern
PremiumPremium
Chronological business sequence showing printed analytics and smartphone dashboard across clip: early frames present report and mobile charts for initial
PremiumPremiumGenerated by AI
Dynamic data visuals for business info graphics, animated charts, and data-driven insights for a business meeting mock-up. Explore the world of trading, stock exchanges, and crypto
PremiumPremium
Animation of data charts and graphs over network connections on dark background
PremiumPremiumGenerated by AI
Animation of data analytics and coding overlaying graphs and pie charts in school
PremiumPremiumGenerated by AI
Financial Market Data Visualization with Glowing Lines and Pixelated Background
Cooling Fan in Scientific Lab
Overhead angle captures a business meeting with hands analyzing charts and graphs
PremiumPremium
Dynamic data visuals for business info graphics, animated charts, and data-driven insights for a business meeting mock-up. Explore the world of trading, stock exchanges, and crypto
PremiumPremium