Analytics videos

- Page 3
Business woman typing on computer keyboard.
Animation of radiation symbol with pie charts on financial graphs and world map
PremiumPremiumGenerated by AI
Data Chart Animated Loop Red 02
Young business people discussing on white board
Tired businessman touching head while anayzing data
Animation of financial data processing on black background
PremiumPremiumGenerated by AI
Surprised business man celebrating good results
Smiling business man looking document paper on workplace
Business team discussion
Translucent padlock icon visualizing cyber analytics showing neon line graphs and donut chart
PremiumPremiumGenerated by AI
Analytical Data Dashboard Showcasing AI Parameters and Insights with Interactive Graphs and Metrics for Enhanced Decision-Making and Visualization
PremiumPremiumGenerated by AI
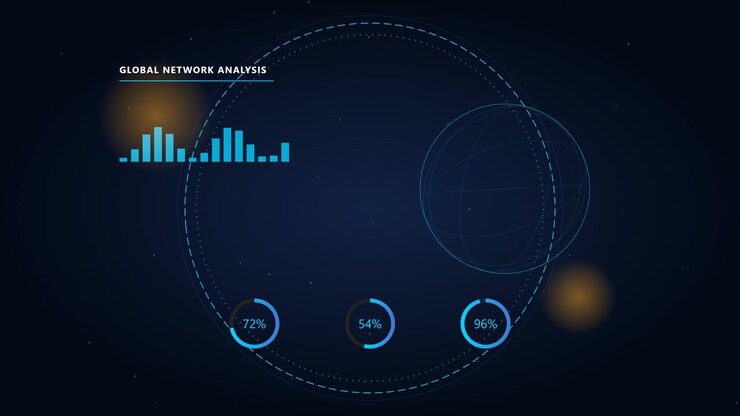
Digital Global Network Analysis Interface with Data Visualization
PremiumPremium
Analyzing Data Trends: A Close-Up Look at Data Visualization on a Laptop with Colorful Graphs and Charts in a Modern Workspace Environment
PremiumPremiumGenerated by AI
Bar chart animating through data after slider drag, bars changing height and fills to show trends
PremiumPremium
Tired businessman stretching and yawning near computer in night office
Futuristic dashboard being animated on grid showing radial pie charts with moving labels
PremiumPremiumGenerated by AI
A Modern Data Visualization Dashboard with Interactive Graphs and Performance Metrics Displayed in Shades of Blue and White, Featuring Abstract Geometric Elements
PremiumPremiumGenerated by AI
Top View Shot Of Business Consultant And Businesspeople Sitting At Table And Discussing Documents
Business Team Analyzing Data and Project Plans
Abstract digital data and graphs, network science tech data analysis, cyber space communication modern innovation background,vector art and illustration
PremiumPremium
Digital Data Dashboard with Animated Charts and Graphs
PremiumPremium
Exhausted financial analyst studying graphs with business statistics
Financial Data Analysis and Business Intelligence Visualizations
Opening grid starting pie charts emerging, bars shifting, graphs tracing trends to visualize data
PremiumPremium
An animation of a Gradient winter solstice infographic template
A Modern Workspace Featuring Advanced Data Analytics on Display, Highlighting a Sleek Laptop with Vibrant Visualizations and a Cozy Office Ambience
PremiumPremiumGenerated by AI
Innovative Data Visualization Concept: A High-Tech Interactive Dashboard Displaying Detailed Analytics and Performance Metrics in a Modern Workspace Environment
PremiumPremiumGenerated by AI
Professional business team having fun during meeting in creative office
Analyzing data with bar graphs on digital grid featuring blue circular patterns
PremiumPremiumGenerated by AI
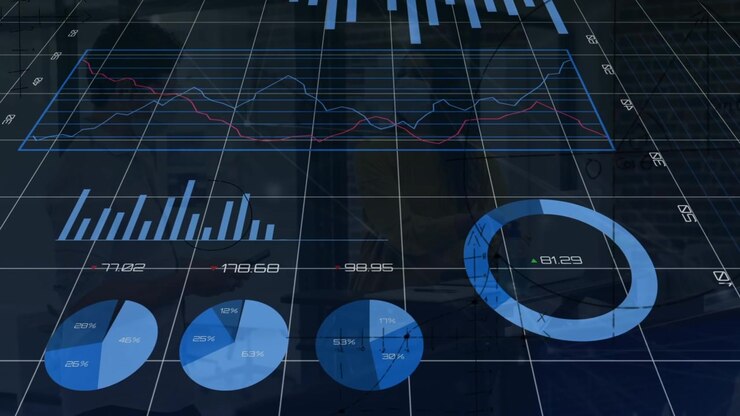
Animated Digital Business Data Graphs and Charts Overlay
PremiumPremium
Central panel displaying two colored line graphs floating on dark grid, including heatmap and map
PremiumPremium
Upset woman manager leaning back on chair
Abstract Digital Interface Displaying Business Data and Statistics
PremiumPremium
Casual businessman working with data analytics in office at night
Dark 3D analytics panel floating above black grid showing translucent bars, data lines, pie charts
PremiumPremiumGenerated by AI
Digital Financial Dashboard Displaying Real-Time Data Analytics
PremiumPremium
Wall of glowing blue digital dashboards filled with charts, graphs and network diagrams in a control room
PremiumPremiumGenerated by AI
Animation of digital graphs and data charts overlaying blue grid background
PremiumPremiumGenerated by AI
Hand Interacting with Digital Data Dashboard on Screen
PremiumPremiumGenerated by AI
Financial Analytics Dashboard With Stock Market Growth Charts On Digital Display
PremiumPremiumGenerated by AI
Focused professional analyzing data trends on a tablet in a modern office environment, highlighting technological integration and business insights for growth.
PremiumPremiumGenerated by AI
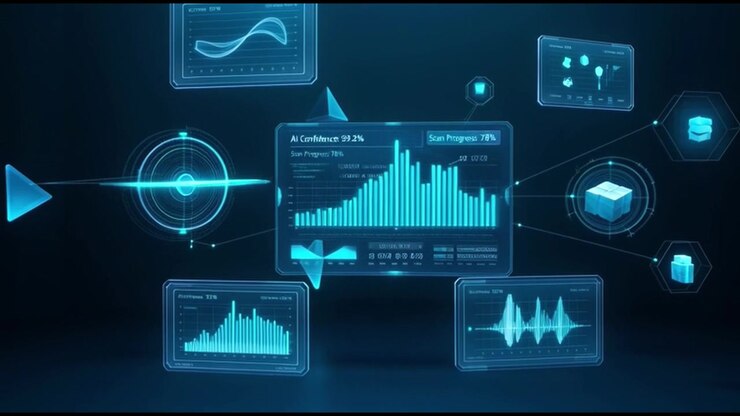
Futuristic Digital Interface with Data Visualization and AI Analytics
PremiumPremium
Data Visualization of Project Zephyr: A Comprehensive Overview through Dynamic Graphs and Charts Showcasing Sales and Analytics Performance Metrics
PremiumPremiumGenerated by AI
Data Chart Animated Loop Front Red
Animated Financial Growth Dashboard Displaying Rising Bar Charts Analytics Graphs And Business Performance Metrics
PremiumPremiumGenerated by AI
Analyzing financial data with animated graphs and charts on futuristic digital interface
PremiumPremium
Gender Distribution Infographics
Data Chart Animated Loop Front Green
Concentrated business analyst watching document
Futuristic Data Visualization on a Computer Monitor
PremiumPremium