Benchmarks videos

- Page 5
Animation of graph over diverse coworkers sharing ideas and putting hands together in office
PremiumPremium
Dynamic data visuals for business info graphics, animated charts, and data-driven insights for a business meeting mock-up. Explore the world of trading, stock exchanges, and crypto
PremiumPremium
Animation of financial data processing over mathematical equations on white background
PremiumPremiumGenerated by AI
healthcare team examining X-ray and tablet in clinic showing animated bar graphs and waveforms
PremiumPremium
Dna structure spinning against mathematical equations against grey background
PremiumPremiumGenerated by AI
Couple chopping greens as cooking progresses animating health bar chart and trendlines rising
PremiumPremium
Animation of statistics and data processing on grey background
PremiumPremiumGenerated by AI
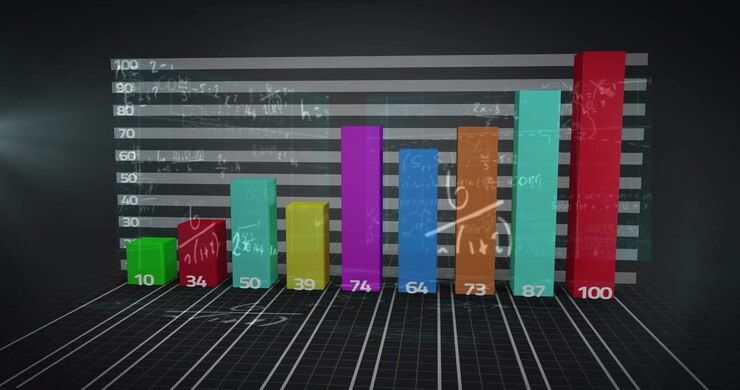
Colourful bar chart growing
PremiumPremium
Animation of graph and months on navy background
PremiumPremiumGenerated by AI
Colorful bars grow sequentially on a grid to illustrate IQ score frequency normal distribution
PremiumPremium
Animation of statistics and digital data processing over black background
PremiumPremiumGenerated by AI
Seated player covering face post goal sports data animating over him bar chart pie KPIs updating
PremiumPremium
Man and woman exchanging papers, initiating finance charts overlaying papers and guiding review
PremiumPremium
Business data analytics animation over diverse colleagues discussing in modern office
PremiumPremium
Woman handing paper to man, both reviewing and signing deal, animated charts rising, business
PremiumPremium
Statistical data processing against mid section of businessman and businesswoman shaking hands
PremiumPremiumGenerated by AI
Animation of statistics processing over mathematical equations and data on screens
PremiumPremiumGenerated by AI
Work data document graph chart report marketing research
PremiumPremium
Animation of statistics and financial data processing over caucasian woman using smartphone
PremiumPremium
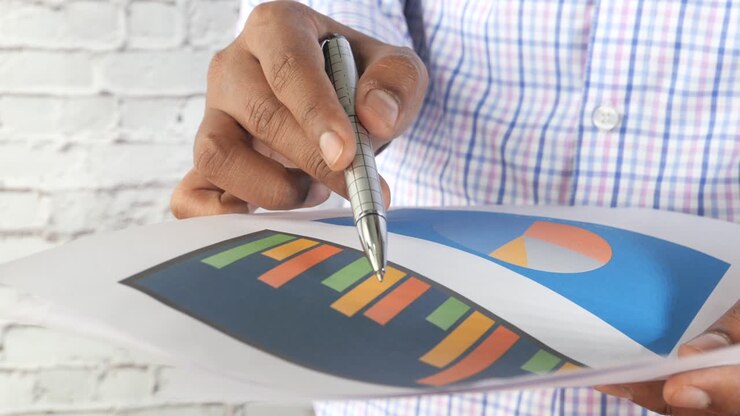
African American businessman looks business report with chart company indicators
PremiumPremium
Network of digital icons and speedometer against group of businesspeople discussing at office
PremiumPremiumGenerated by AI
Colorful bar graph animation over people using payment terminal in store
PremiumPremiumGenerated by AI
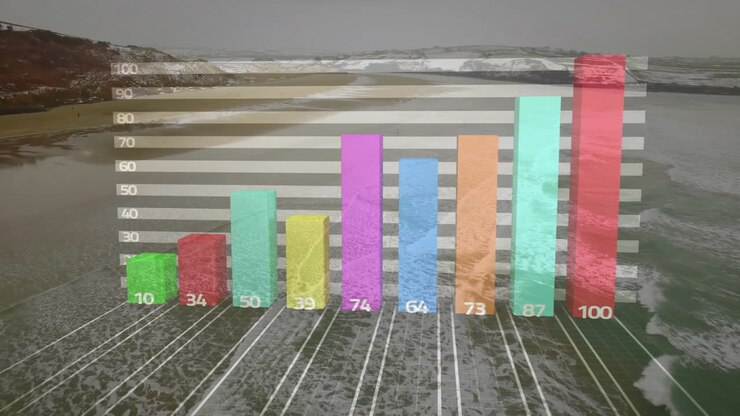
Animation of colorful bar graph displaying numerical data over coastal landscape
PremiumPremiumGenerated by AI
Three dimensional pie chart growing
PremiumPremiumGenerated by AI
Colorful Data Visualization Bar Graph
PremiumPremiumGenerated by AI
Animated Nutri-Score label with letter C popping up on blue chroma key in a seamless loop
PremiumPremium
Seated woman pointing at documents and leading design review, animated bar chart growing over table
PremiumPremium
Team of three chatting in meeting, chat launching overlay 3D bars rising showing business growth
PremiumPremium
Animation of graph and falling food over notes
PremiumPremiumGenerated by AI
Analyzing Data Trends: A Close-Up View of Touching Colorful Graphs and Charts for Effective Insights and Decision-Making in Business Analysis
PremiumPremiumGenerated by AI
Statistical data processing against woman using smartphone
PremiumPremiumGenerated by AI
Animation of statistics processing over mathematical equations and data on screens
PremiumPremiumGenerated by AI
Animation of world map and data processing over business people walking
PremiumPremium
Animation of statistics processing over businessman handshake
PremiumPremiumGenerated by AI
Animation of graphs and financial data over servers
PremiumPremiumGenerated by AI
Animation of statistical data processing over grid network against waving bulgaria flag background
PremiumPremium
Animation of financial graph over financial data processing
PremiumPremiumGenerated by AI
Animation of financial data processing over diverse colleagues discussing work in office
PremiumPremium
Dna structure spinning against mathematical equations against grey background
PremiumPremiumGenerated by AI
Three pie charts, diagram for presentation.
PremiumPremium
Optical Phenomena: Light, Color, and Dispersion
PremiumPremium
Colleagues sitting, man typing starting animated bars and rising lines, analyzing business data
PremiumPremium
Animation of financial data processing over mathematical equations on black background
PremiumPremium
Business Charts on Corkboard
PremiumPremiumGenerated by AI
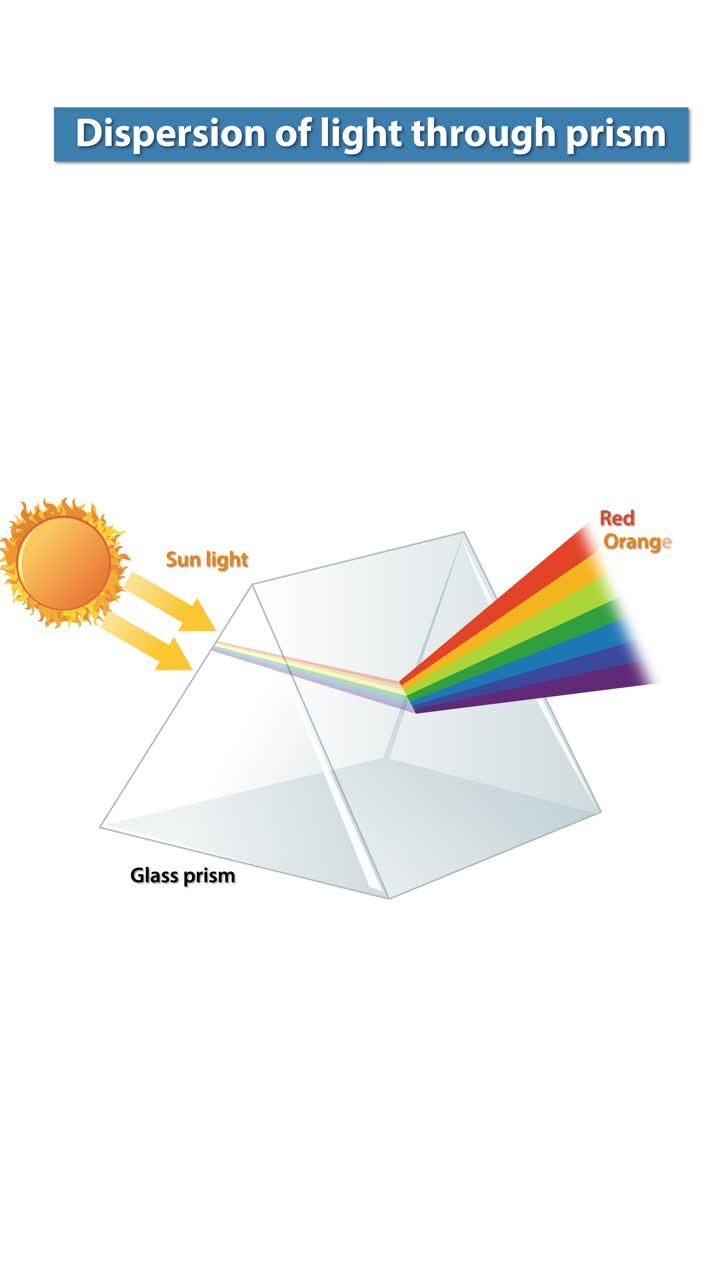
Animation illustrating sunlight dispersion into a spectrum through a glass prism, highlighting color separation and refraction
PremiumPremium
Financial data and analytics animation over fluctuating stock market graphs
PremiumPremium
Business Presentation with Charts and Graphs
PremiumPremium
Statistical data processing against mid section of businessman and businesswoman shaking hands
PremiumPremiumGenerated by AI
Animation of graphs over infographic interface against black background
PremiumPremiumGenerated by AI
African American colleagues with man wearing blue shirt, woman holding charts reviewing at laptop
PremiumPremium