Charting videos

- Page 10
Financial data and stock market analysis animation with graphs and charts
PremiumPremium
Startup team reviewing annual reports infographics on interactive board
PremiumPremium
Designer Sketching in Copybook at Table indoors
PremiumPremium
Digital Data Visualization of Renewable Energy and Environmental Metrics
PremiumPremium
Coworkers at desk with monitor showing rising charts, woman gesturing and explaining data
PremiumPremium
Dynamic data visuals for business info graphics, animated charts, and data-driven insights for a business meeting mock-up
PremiumPremium
Animation of digital data processing over network of connections
PremiumPremium
Animated Financial Stock Market Line Graph with Bar Chart
PremiumPremium
Digital composite of financial charts 4k
PremiumPremium
Financial data being processed on a transparent background
PremiumPremiumGenerated by AI
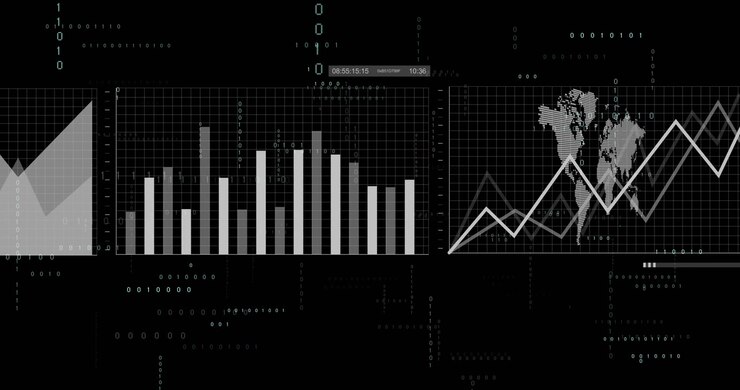
Data and report statistics, animation with graph diagrams.
PremiumPremium
Analyzing Data Trends: A Close-Up of Finger Interaction with Interactive Financial Graphs Displayed on a Digital Tablet Screen, Showcasing Metrics and Statistics
PremiumPremiumGenerated by AI
Graphs of Nucleic Acid Sequence
PremiumPremiumGenerated by AI
trainer spotting trainee in gym, displaying animated multicolored bar graph and fitness line chart
PremiumPremium
Animation of blue charts processing data on interface with black background
PremiumPremiumGenerated by AI
Animation of network of connections with data processing and diagrams over black background
PremiumPremiumGenerated by AI
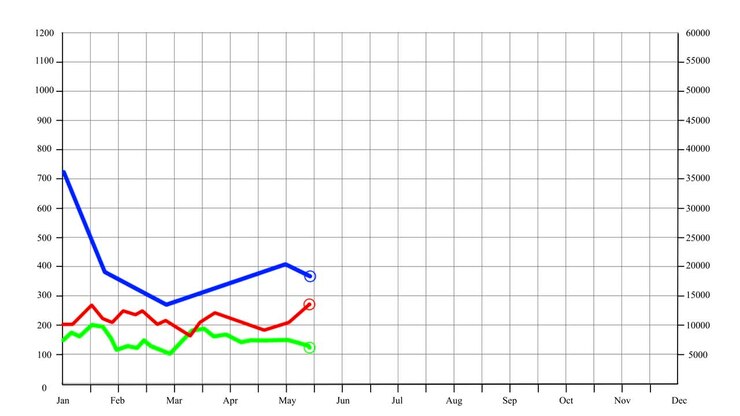
Line graphs with different colours
PremiumPremiumGenerated by AI
Animation of digital data processing and graph over clack background
PremiumPremium
Business chart and graph on a white background.
PremiumPremium
Animation of molecules and mathematical equations over graph on grey background
PremiumPremiumGenerated by AI
Vertical Futuristic Digital Display Showing Financial And Stock Market Data
PremiumPremiumGenerated by AI
Animation of graphs and changing numbers over african american man working on laptop in office
PremiumPremiumGenerated by AI
Bars fading in, growing in size while red code and trend line scrolling showing data trends
PremiumPremium
Financial bonds graphs and business bar infographic charts with rising line
PremiumPremium
Animation of multicolored graphs over grid pattern against black background
PremiumPremium
Color Correction Timeline With Cursor Arrow Moving On Computer Monitor
PremiumPremium
Animated Candlestick Chart Showing Financial Market Trends
PremiumPremium
Animation of network of connections over light trails
PremiumPremiumGenerated by AI
Animated Financial Data Chart Showing Growth Trends
PremiumPremium
Animation of digital data processing on screen over black background
PremiumPremium
Animated Financial Line Graph Showing Market Fluctuations
PremiumPremium
Business And Finance Growth Infographic Bar Graph Or Chart Animation
PremiumPremium
Animated data graph for stats analysis, reports and financial. Ideal for financial, banking, scientific and mathematical medical topics. 4k alpha channel.
PremiumPremium
Animation of finacial data processing over cityscape
PremiumPremium
Animated Bar Chart and Line Graph Data Visualization
PremiumPremium
Big Data - Education Infographics 37
PremiumPremium
Animation of data processing over light spots on black background
PremiumPremiumGenerated by AI
Stock Market Bar Graph
PremiumPremium
Financial graph shown over navy background
PremiumPremiumGenerated by AI
Animation of data processing over purple light trails
PremiumPremiumGenerated by AI
Animation of graphs over midsection of caucasian woman zooming picture on cellphone
PremiumPremium
Fluctuating bar and line graph animation over solar panel background
PremiumPremium
Dashboard unfolding on update for analytics, shifting panels and animating line, area, bars, map
PremiumPremium
Statistics, financial market data, analysis and reports, numbers and graphs. Loopable animated opening video.
PremiumPremium
Stock Market Analysis Graph
PremiumPremium
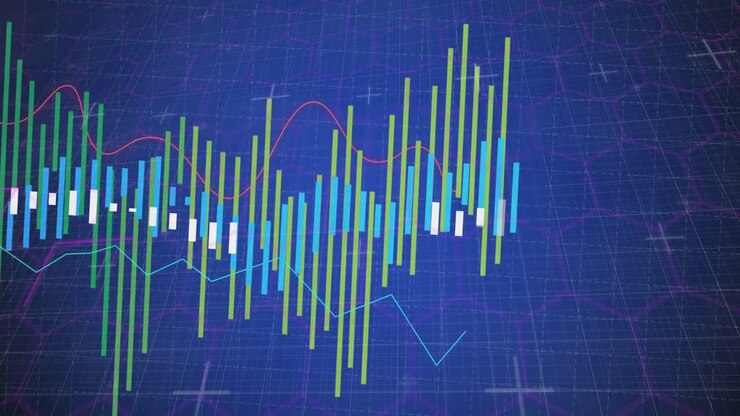
Candlestick chart bars dancing on flat design grid, showing overlaid red and turquoise line data
PremiumPremium
Data Analyst Using a Stylus on a Laptop with Financial Charts
PremiumPremiumGenerated by AI
Animation of statistical data processing against office desk sketch on blue background
PremiumPremium
Telemetry pulse arriving, bar waveform shifting right, changing colors, revealing security risk
PremiumPremium
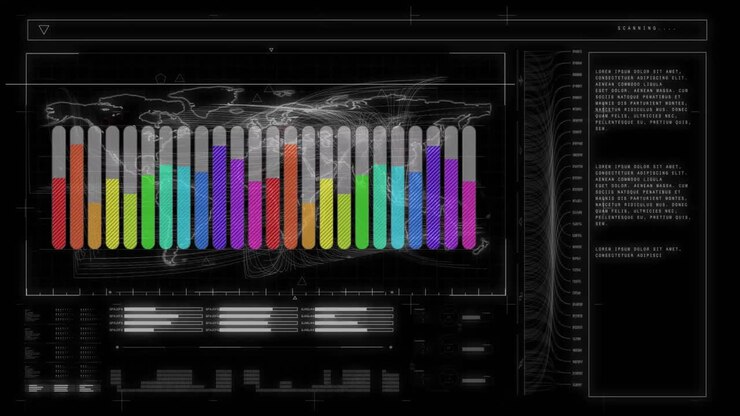
World map with graphs and statistics
PremiumPremiumGenerated by AI