Charting videos

- Page 19
Digital animation of statistical data processing against white background
PremiumPremium
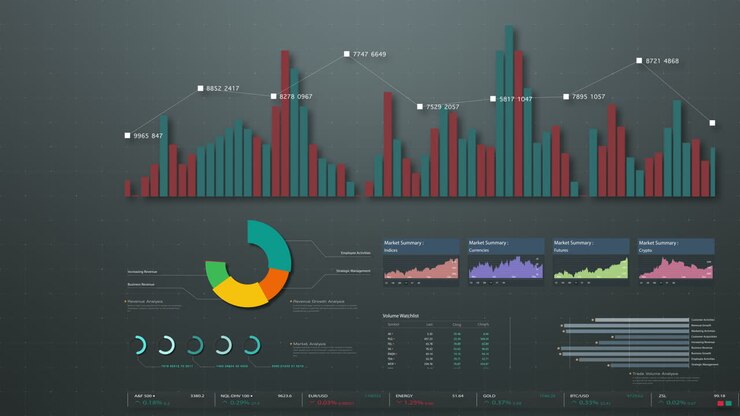
Digital Dashboard Displaying Real-Time System Analytics and Data Trends
PremiumPremium
Animation of financial data processing over grid on dark background
PremiumPremiumGenerated by AI
Animated Financial Chart Showing Market Growth and Volatility
PremiumPremium
Business Presentation
PremiumPremium
Animation of financial data processing on black background
PremiumPremiumGenerated by AI
Digital data visualization chart displaying pixel bars and line graphs in flat design interface
PremiumPremiumGenerated by AI
Animation of digital data processing over grid on dark background
PremiumPremiumGenerated by AI
African American Businessman Presenting Annual Report on Digital Screen
PremiumPremium
statistics bars infographic business animation
PremiumPremium
Bars filling up with different colours on a grid
PremiumPremiumGenerated by AI
Animation of financial data processing on black background
PremiumPremiumGenerated by AI
Statistical graph with business finance concept, 3d rendering.
PremiumPremium
Animation of graphs and math formulas on navy background
PremiumPremiumGenerated by AI
On start multi-line chart showing three color traces rising, crossing, layering, visualizing trends
PremiumPremium
Animation of mathematical equations and statistical data processing against green background
PremiumPremiumGenerated by AI
Business stock market, trading, info graphic with animated graphs, charts and data numbers insight analysis to be shown on monitor display screen for business meeting mock up theme
PremiumPremium
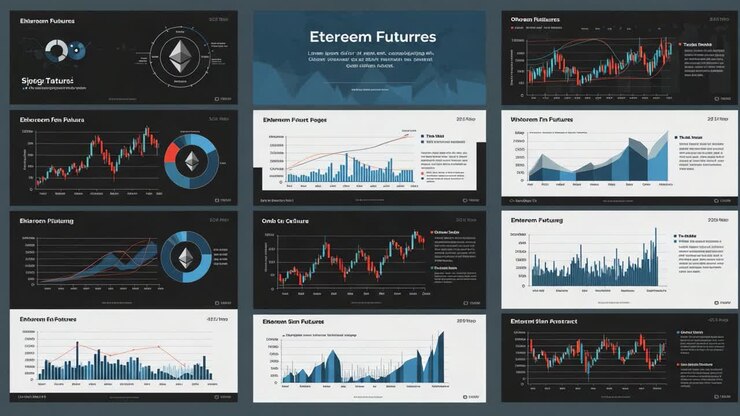
Comprehensive Analysis of Etereem Futures: Trends, Graphs, and Insights for Investors Exploring the Future of Digital Assets and Market Dynamics
PremiumPremiumGenerated by AI
Line graphs with colourful segments
PremiumPremiumGenerated by AI
Man silhouette examining data in tech briefing, showing animated bar charts and line graph
PremiumPremiumGenerated by AI
Business stock market, trading, info graphic with animated graphs, charts and data numbers insight analysis to be shown on monitor display screen for business meeting mock up theme
PremiumPremium
Digital icons on grid network over of profile icons on blue background
PremiumPremiumGenerated by AI
animation of graphics, Financial diagram and charts showing profits and losses. Elements for user interface UI, or infographics. template and graph corporate and business presentation. 3d modern style
PremiumPremium
Business Data Visualization Dashboard
PremiumPremium
Casual colleagues presenting something on clipboard
PremiumPremium
Annual Report and Financial Data Analysis
PremiumPremium
Graphs and charts animation over grid background with world map
PremiumPremium
graph bar six color and animation display grow or increase trend and radar on top bar
PremiumPremium
Animation of mathematical equations over businessman using computer
PremiumPremium
Vertical video: Teal particles drifting, HUD bars pulling back and tilting, showing numeric trends
PremiumPremium
Animation of financial and statistical data processing over world map against black background
PremiumPremiumGenerated by AI
Animation of data processing over businesswoman using phone headset
PremiumPremiumGenerated by AI
Animation of mathematical equations and statistical data processing against green background
PremiumPremiumGenerated by AI
Animated dark theme digital navigation map UI interface showing routes in Hillside Quarter
PremiumPremium
After network loading, bars rising, shifting, changing hues and oscillating to visualize waveform
PremiumPremium
Animation of data processing over screen on dark background
PremiumPremiumGenerated by AI
On load chart UI, green cyan bars rising, shifting while red line oscillating showing trend
PremiumPremium
Dynamic data visuals for business info graphics, animated charts, and data-driven insights for a business meeting mock-up
PremiumPremium
Animation of multiple graphs and trading board on grid pattern against black background
PremiumPremium
Abstract Digital Audio Waveform Visualization with Glowing Bokeh Background
PremiumPremium
Analyzing financial data charts with candlestick patterns and time indicators
PremiumPremium
Digital Dashboard Displaying Real-Time Data Analytics and Growth Metrics
PremiumPremium
Animated Bar Chart and Line Graph Showing Data Trends
PremiumPremium
Vertical video: Presenter drawing trend on chart after raised hand, illustrating data with overlays
PremiumPremium
Animated Bar Chart and Line Graph Showing Financial Data Growth
PremiumPremium
Animated Bar Chart with Moving Data Points and Trend Line
PremiumPremium
At second mark three colored graphs sliding over undulating mesh wave on 3D grid visualizing trends
PremiumPremium
Animation of financial data processing over screens on black background
PremiumPremium
Animated Bar Chart with Trend Line Growing on Grid Background
PremiumPremium
Animated Line Graph and Bar Chart Growth Visualization
PremiumPremium