Charting videos

- Page 8
Animation of financial data processing and statistics with lines
PremiumPremiumGenerated by AI
Animation of statistics and data processing over grid
PremiumPremium
Wheelchair and economic report charts on notebook in inclusive company office
PremiumPremium
Animation of infinity sign, statistics and data processing
PremiumPremium
Vertical Bar Chart - Infographics Video Template
PremiumPremium
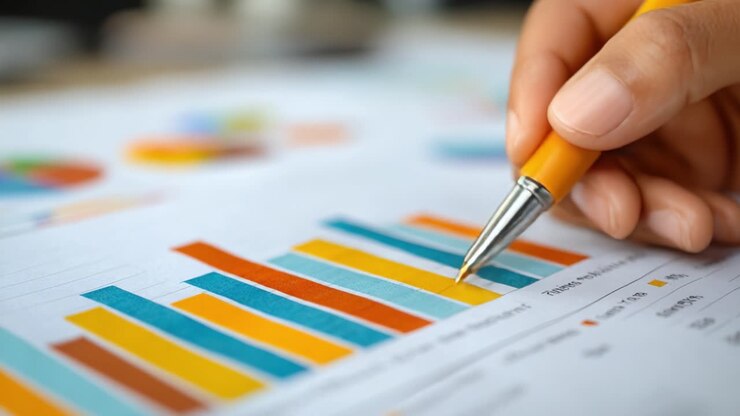
Analyzing Data Trends: A Close-Up View of Graphs and Charts Highlighting Performance Metrics and Insights for Effective Decision Making
PremiumPremiumGenerated by AI
Animation of radar screen with fluctuating graph lines and numerical data points
PremiumPremium
Growing line chart graph - business development competition concept animation. Hi tech style charts with grid. Camera movement with depth of field
PremiumPremium
Animated Financial Candlestick Chart with Moving Trend Lines
PremiumPremium
Dual gradient business line chart with circle points animation isolated on blue background
PremiumPremium
Animation of financial data processing on white background
PremiumPremium
Animation of diagram and data processing over network of connections
PremiumPremium
Analyzing Financial Data on a Digital Tablet: An Insightful Process of Interpreting Stock Market Trends and Price Movements Through Visual Graphs
PremiumPremiumGenerated by AI
Animation of data processing over monitor and payment terminal
PremiumPremium
Animation of interface with statistical data processing against purple gradient background
PremiumPremiumGenerated by AI
Slowly running curves of a life sign at the back screen. Lung ventilator monitor close up
PremiumPremium
Panning camera over 3D candlestick bars on grid, revealing teal and black bars highlighting spike
PremiumPremiumGenerated by AI
Animation of data processing over shapes on black background
PremiumPremiumGenerated by AI
Math graph growing on lined paper, magenta markers moving ribbon forming bars popping showing rise
PremiumPremium
Vertical video: HUD showing cursor appearing drawing three neon waves marking peaks for readout
PremiumPremium
Financial data processing against network of connections on blue background
PremiumPremiumGenerated by AI
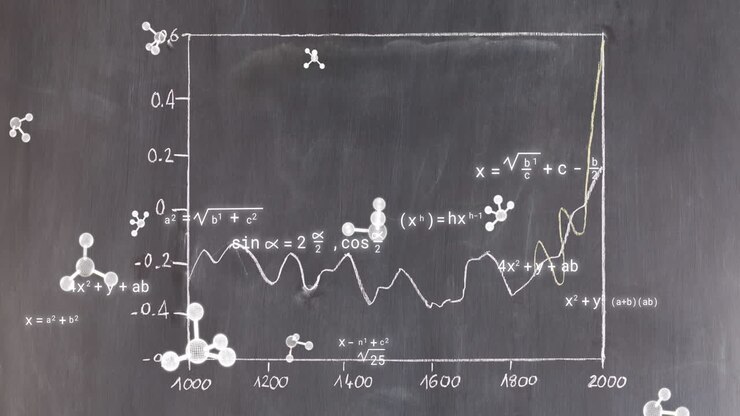
Animation of molecules and mathematical equations over graph on grey background
PremiumPremiumGenerated by AI
Animated Results Summary with Three Smooth Line Graphs
PremiumPremium
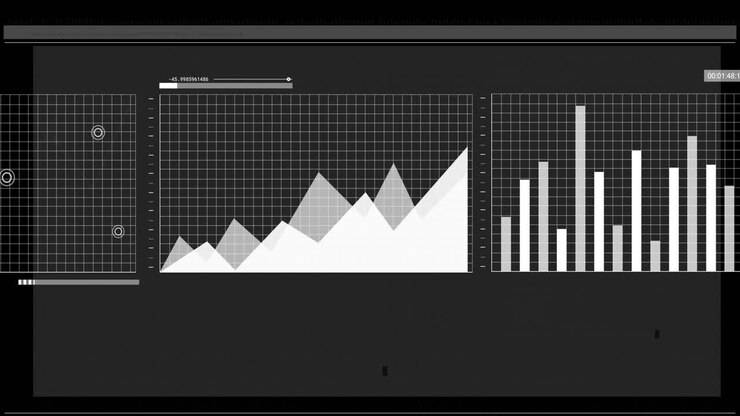
Animation of white graphs and charts processing data on black background
PremiumPremiumGenerated by AI
Animation of financial data processing with statistics over grid
PremiumPremiumGenerated by AI
Lead pointing at screen, woman in pink scanning docs, marking as graphs showing business data
PremiumPremium
Incoming data plotting bars right, red MA sweeping, cyan zigzag tracing, showing finance trends
PremiumPremium
Animation of financial data processing with statistics over grid
PremiumPremiumGenerated by AI
Animated Financial Candlestick Chart Showing Market Trends
PremiumPremium
Animation of abstract pattern over graph and increasing numbers with multiple currency symbols
PremiumPremiumGenerated by AI
Animated video of financial graphs representing business and finance data
PremiumPremium
Incoming pulse starting multi traces peaking, numbers appearing, blue helixes sliding, for analysis
PremiumPremium
Colorful 3D graph with data points and wave patterns, data analysis animation
PremiumPremium
Animation of diagrams with numbers and data processing on white background
PremiumPremiumGenerated by AI
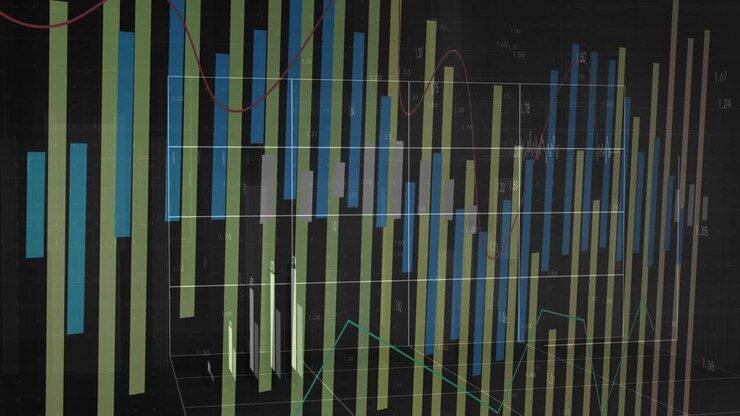
Green bars emerging lower-left, segments appearing as camera panning to reveal dynamic data trends
PremiumPremium
Businesswoman with Digital Tablet in Modern Office
PremiumPremium
Futuristic Digital Interface Displaying Data Graphs and Charts
PremiumPremiumGenerated by AI
Graph on Computer Screen
PremiumPremium
Analyzing Data: Visualizing and Interpreting Trends through Colorful Charts and Graphs with a Focused Approach for Effective Decision Making
PremiumPremiumGenerated by AI
Business stock market, trading, info graphic with animated graphs, charts and data numbers insight analysis to be shown on monitor display screen for business meeting mock up theme
PremiumPremium
Animation of data processing over light spots on black background
PremiumPremiumGenerated by AI
Animation of network of connections over light trails
PremiumPremiumGenerated by AI
Animation of statistical data processing over grid network against grey background
PremiumPremium
Futuristic neon magenta ECG waveform pulsing over 3D grid, displaying red blue line and bar charts
PremiumPremiumGenerated by AI
Animation of multiple graphs on white grid
PremiumPremiumGenerated by AI
Grid initializing then light-blue jagged line growing and receding visualizing data fluctuation
PremiumPremium
An In-Depth Look at Data Analysis: The Fascinating Interaction of a Hand Guiding Over Colorful Metrics and Statistics on a Modern Digital Interface
PremiumPremiumGenerated by AI
Animated Data Visualization with Line Graph and Bar Chart
PremiumPremium
Turquoise line graph showing markers and numeric annotations with neon green line on purple grid
PremiumPremiumGenerated by AI
Music production in the modern professional studio. Screen with sound analyzing program is on. Close up
PremiumPremium