Incremental videos

- Page 7
Animation of financial data processing and arrows over globe on blue background
PremiumPremiumGenerated by AI
It can only go up from here
PremiumPremium
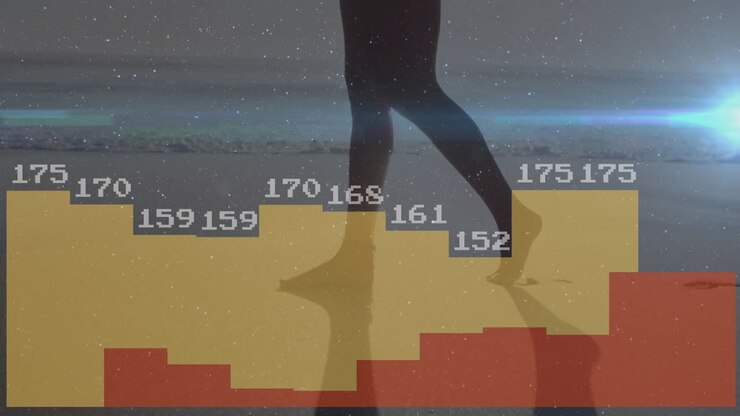
Walking over colorful bar graph, silhouette of person with animation in school
PremiumPremiumGenerated by AI
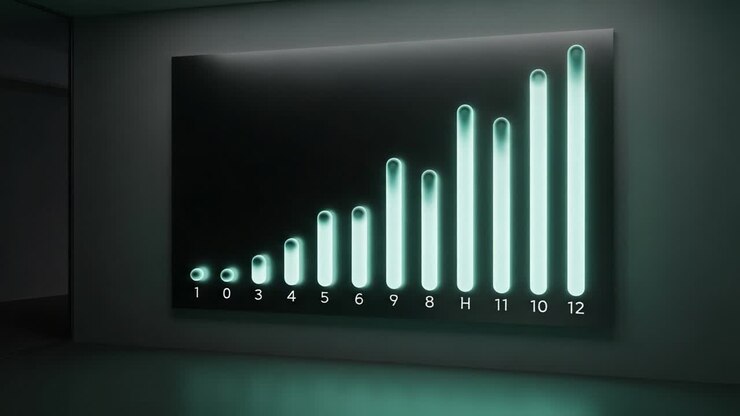
A Futuristic Display of Progress: A Series of Glowing Bars Illustrating Data Trends and Growth Over Time in a Contemporary Setting
PremiumPremiumGenerated by AI
Bar chart animation showing increasing data values over dark gradient background
PremiumPremium
Animation of white arrows pointing up over landscape
PremiumPremiumGenerated by AI
Blue bar graph appearing from the ground
PremiumPremium
Animation of financial data processing with red arrow over city
PremiumPremiumGenerated by AI
Graph chart with arrow
PremiumPremium
Chart showing changing statistics
PremiumPremiumGenerated by AI
Descending orbs sparking five tiles rising into bars on green base, rods linking orbs forming line
PremiumPremium
Finance chart receiving live feed moving trend line updating labels, shifting bars showing growth
PremiumPremium
Starting chart showing Profit: +25% with rising bars, extending white line and arrow on screen
PremiumPremiumGenerated by AI
Financial Data Chart
PremiumPremium
statistics arrows bars success animation
PremiumPremium
Abstract looped infographics background with multicolored 3d bars on blue bg. Downgrade graph from columns. Economic background with copy space in 4k. 3d bars as chart of statistic data.
PremiumPremium
A seamless looping animation of a 3D business data visualization. The digital infographic bars represent progress and growth, perfect for professional, corporate, and technological themes
PremiumPremium
Rising bar chart with red arrow animation over serene landscape background
PremiumPremium
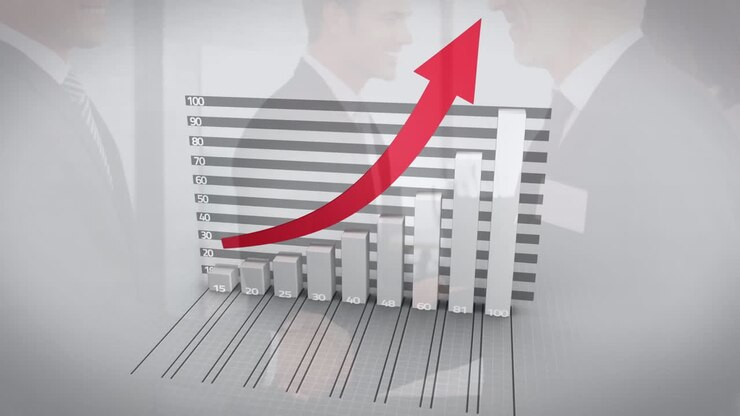
Animation of data processing over caucasian businessmen smiling
PremiumPremiumGenerated by AI
Animation of moving arrows and increasing numbers on purple background
PremiumPremiumGenerated by AI
A seamless looping animation of a 3D business data visualization. The digital infographic bars represent progress and growth, perfect for professional, corporate, and technological themes
PremiumPremium
Animation of data processing over caucasian businessmen smiling
PremiumPremiumGenerated by AI
Arrow neon sign on brick wall 4k
PremiumPremium
Animation starting central bar cluster rising along seam on glossy tiles, green overtaking red
PremiumPremiumGenerated by AI
Animation of financial data processing over grid
PremiumPremiumGenerated by AI
Vertical video: Dotted globe rotating as metrics appearing, purple arrows rising and showing trends
PremiumPremium
Animation of statistical data processing against overhead view of city traffic
PremiumPremiumGenerated by AI
Chart showing changing statistics
PremiumPremiumGenerated by AI
Graph growing with arrow
PremiumPremium
3d man presenting a bar graph
PremiumPremium
Chart showing changing statistics
PremiumPremiumGenerated by AI
Blue upward circuit arrow background glowing tech symbols dark gradient space digital growth motion
PremiumPremium
3d bar chart animation, rising up in stages
PremiumPremium
Animation of multiple arrow icons moving upwards and network of connections against server room
PremiumPremiumGenerated by AI
Chart showing changing statistics
PremiumPremiumGenerated by AI
Animation of mathematical symbols and web of connections with social icons floating
PremiumPremiumGenerated by AI
Animated Financial Candlestick Chart with Neon Glow Effect
PremiumPremium
Chart showing changing statistics
PremiumPremiumGenerated by AI
Animation of multiple arrow icons moving upwards and network of connections against server room
PremiumPremiumGenerated by AI
Animation of financial data processing with red arrow over diverse business people in office
PremiumPremiumGenerated by AI
Animation of statistical data processing against grey background
PremiumPremiumGenerated by AI
Vertical digital growth graph with rising bars, symbolizing business performance improvement, financial analytics, strategic progress and modern data visualization for presentations
PremiumPremium
Chart showing changing statistics
PremiumPremiumGenerated by AI
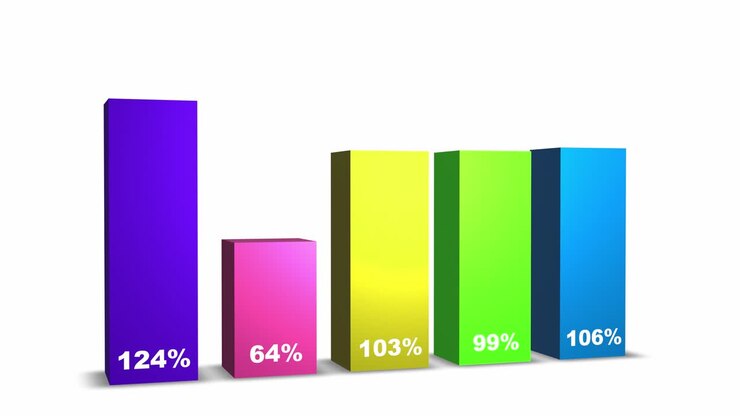
Modern 3D bar chart with green and red bars on a clean white background, representing stock market data, business trends and financial performance visualization
PremiumPremium
Dramatic Progression of a Bar Graph Illuminated by Neon Lighting, Signifying Growth and Success Across a Dimly Lit, Stylish Environment
PremiumPremiumGenerated by AI
Animation of graph over electric car during charging
PremiumPremiumGenerated by AI
Animation of network of connections over arrows
PremiumPremiumGenerated by AI
Vertical video: Camera pan causing 6 gold arrows growing, shifting right at studio, showing trend
PremiumPremiumGenerated by AI
Animation of diagrams over data processing
PremiumPremiumGenerated by AI
Animation of financial data processing
PremiumPremiumGenerated by AI