Notes chart videos

- Page 11
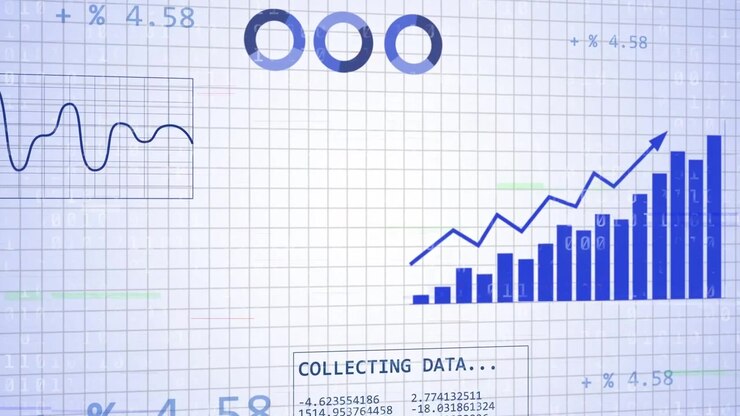
COLLECTING DATA box appearing, blue bar-line chart growing, binary arcs sliding, visualizing growth
PremiumPremium
Business chart and graph on a white background.
PremiumPremium
Glowing bulb emerging triggers bars animating, stacking, connecting line graphs to show data growth
PremiumPremium
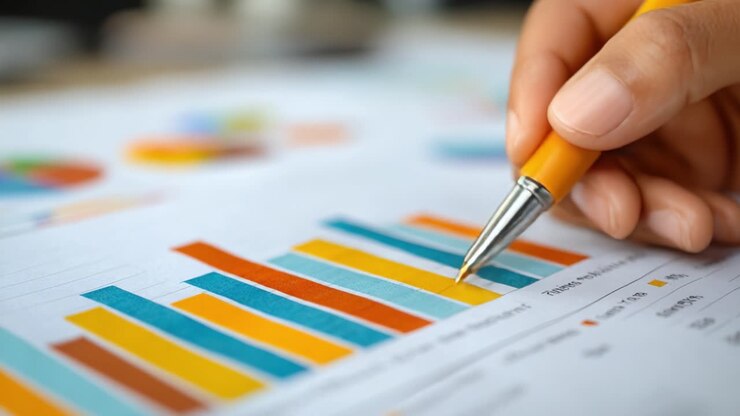
Analyzing Data: Visualizing and Interpreting Trends through Colorful Charts and Graphs with a Focused Approach for Effective Decision Making
PremiumPremiumGenerated by AI
Animation of multiple graphs and trading board over pen beside notebook on desk
PremiumPremiumGenerated by AI
Social media notifications animation over mathematical equations and graphs on black background
PremiumPremium
Big Data - Education Infographics 66
PremiumPremium
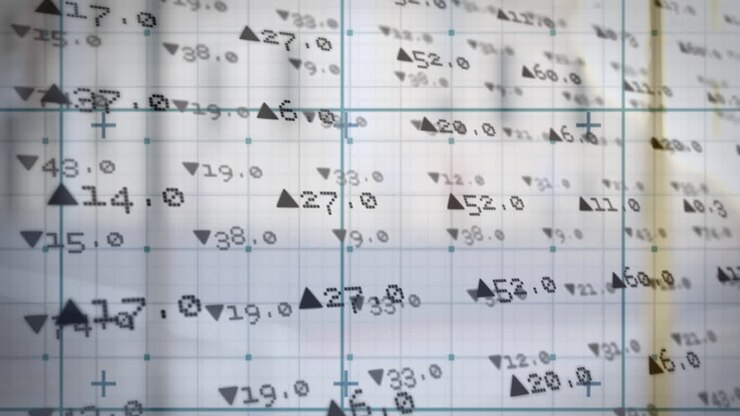
Animation of statistics and data processing over grid
PremiumPremiumGenerated by AI
Animation of digital data processing over grid on dark background
PremiumPremiumGenerated by AI
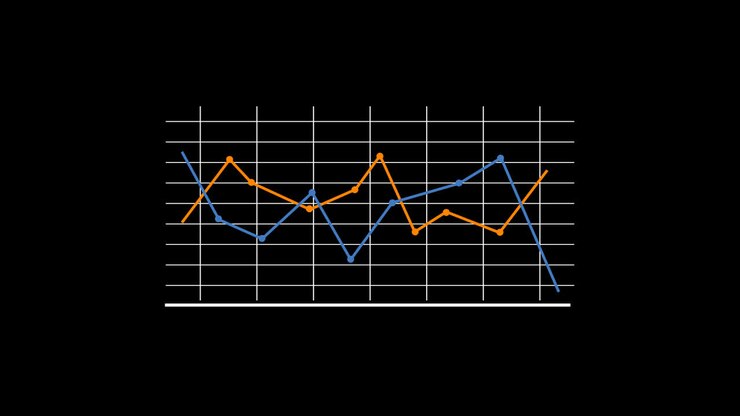
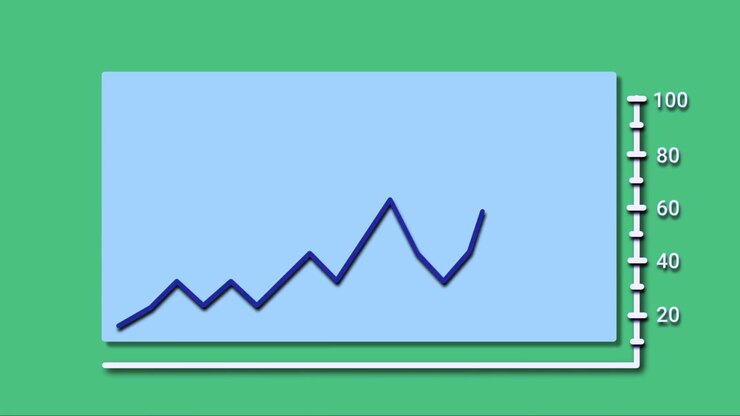
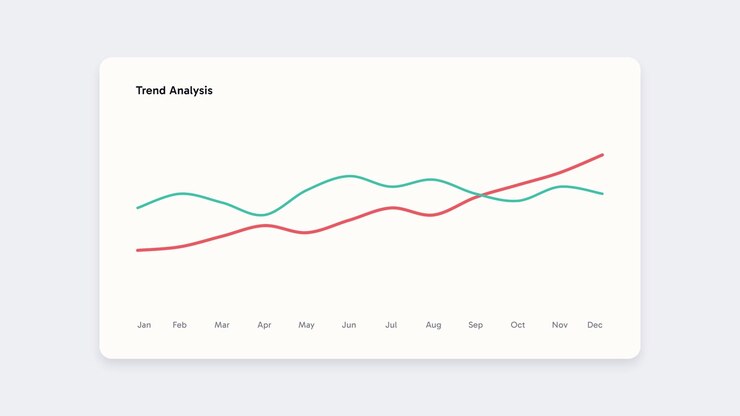
Animated Line Graph Showing Business Growth and Fluctuations
PremiumPremium
Animation of graphs, statistics and financial data processing
PremiumPremiumGenerated by AI
Animation of graphs, statistics and financial data processing
PremiumPremiumGenerated by AI
Animated Candlestick Chart Showing Stock Market Growth
PremiumPremium
Digital Calibration Interface with Rising and Falling Progress Bar
PremiumPremium
Analyzing Data on Tablet and Paper
PremiumPremium
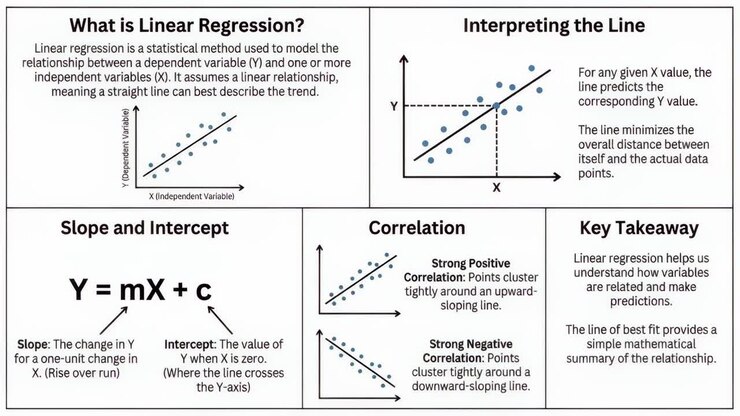
Linear Regression Concepts and Correlation
PremiumPremiumGenerated by AI
Animation of financial data processing over grid
PremiumPremium
Playing back, camera dollying through amber HUD, revealing central data cluster on grid floor
PremiumPremium
SaaS UI Data Visuals 08 | After Effects 2023 | 3840x2160
PremiumPremium
SaaS UI Data Visuals 08 | Premiere Pro 2023 (MOGRT) | 3840x2160
PremiumPremium
Person using a tablet to view graphs and charts
PremiumPremium
Hands of Laboratory Technician Recording Experiment Results in Report
PremiumPremium
Blank chalkboard starting sketching bars and line graph drawing grids formulas labels updating data
PremiumPremium
Animation of statistical data processing over cityscape
PremiumPremiumGenerated by AI
Animation of financial data processing and globe over black background
PremiumPremium
Child's Hand Tracing the Letter L on a Learning Worksheet
PremiumPremium
Draw Lines On The Drawing With A Simple Pencil
PremiumPremium
Animation of statistical data processing over a digital tablet on white surface
PremiumPremiumGenerated by AI
Animation of statistics and financial data processing over grid and notebook
PremiumPremium
Animation of statistical data processing against grey background
PremiumPremiumGenerated by AI
Aerial view of a dynamic 3D graph on a dark grid background, showcasing data analysis
PremiumPremiumGenerated by AI
Animation of data processing against close up of a pen and blank paper on wooden surface
PremiumPremiumGenerated by AI
Woman taking notes
PremiumPremium
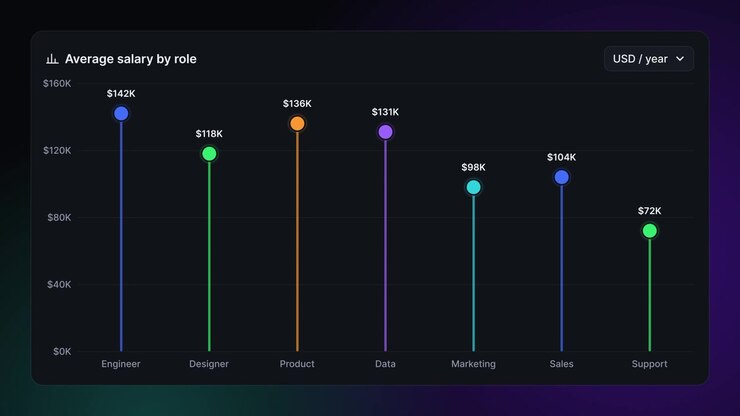
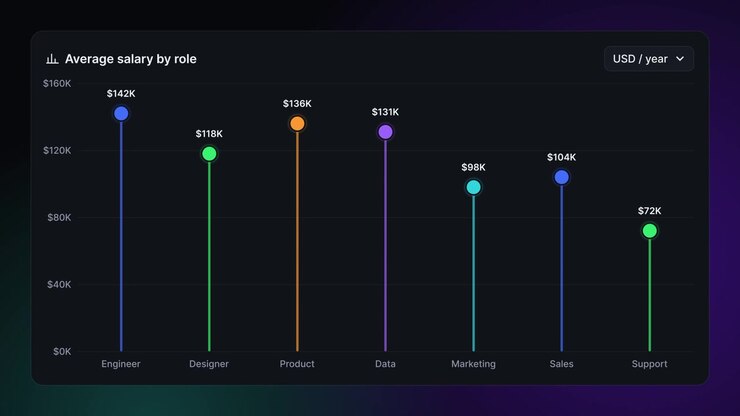
Animated Bar Chart Showing Average Salary by Job Role
PremiumPremium
Line graph and pie chart
PremiumPremiumGenerated by AI
Animation of financial data processing over blue background
PremiumPremiumGenerated by AI
Animated Bar Chart Showing Magazine Circulation Trends Over Time
PremiumPremiumGenerated by AI
Animated Bar Chart Showing Magazine Circulation Trends Over Time
PremiumPremiumGenerated by AI
Animated Bar Chart Showing Average Salary by Job Role
PremiumPremium
The animation shows statistics and financial data being processed on a grid
PremiumPremiumGenerated by AI
Financial data procession against mathematical equations and calculations on white lined paper
PremiumPremiumGenerated by AI
Analytics canvas with ticks appearing, line evolving and labels animating to show engagement trends
PremiumPremium
On data feed start translucent UI panel clarifying while line graphs sweeping to show metric shifts
PremiumPremium
Close-up of financial graphs on a computer screen
PremiumPremium
Animation of statistical data processing over cityscape
PremiumPremiumGenerated by AI
Vertical video: Grid appearing, bar charts panning and tiling, chalk equations annotating trends
PremiumPremium
Animation of statistics and eco data processing
PremiumPremiumGenerated by AI
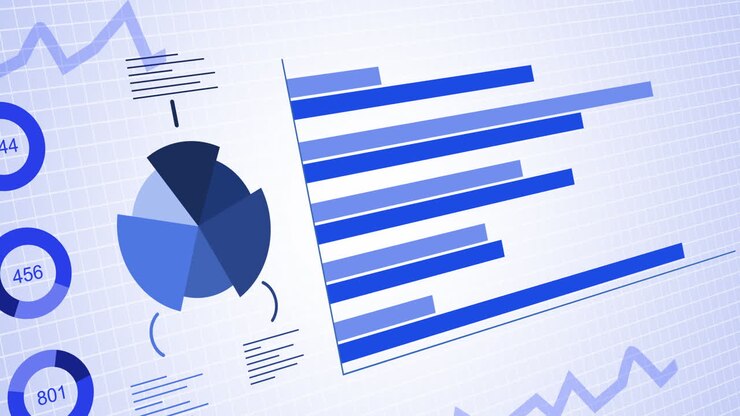
statistics pie infographic document animation
PremiumPremium
Hands hold green pen over graph paper with handwritten notes and diagrams. notebook contains mathematical equations graphs and technical text written in blue ink on grid lined pages. Soft
PremiumPremium
Animation of financial graphs and folder on black background
PremiumPremium