Optimization videos

- Page 18
Animated Infographic Showing User Data and Performance Metrics
PremiumPremium
Animation of marketing strategy text over reading glass and data processing
PremiumPremiumGenerated by AI
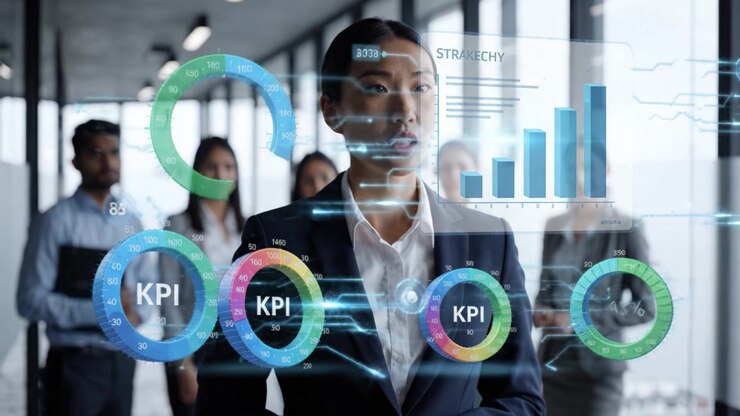
Professional Presentation: A Business Leader Analyzing KPIs and Data Insights in a Corporate Environment with Colleagues Observing Progress
PremiumPremiumGenerated by AI
Animation of scope scanning over financial data processing on black background
PremiumPremiumGenerated by AI
Animation of scope and data processing over cityscape
PremiumPremium
Data analyst starting typing on laptop beside window revealing animated charts for data analysis
PremiumPremium
Animation of data processing in blue background
PremiumPremiumGenerated by AI
Animated Data Dashboard Showing Fluctuating Bar Chart and Circular Progress Indicator
PremiumPremium
Animation of scope and data processing over cityscape
PremiumPremium
Developer placing hands on keyboard and activating blue HUD plus denser code overlay while typing
PremiumPremium
Floating HUD updating on data update, gauges rotating, bars sliding, charts rising showing metrics
PremiumPremium
Financial Analyst Examining Market Trends on an Advanced Interactive Digital Tablet Display
PremiumPremiumGenerated by AI
Pointing man blue shirt responding to donut chart on laptop at meeting, woman gray vest typing
PremiumPremiumGenerated by AI
Business stock market, trading, info graphic with animated graphs, charts and data numbers insight analysis to be shown on monitor display screen for business meeting mock up theme
PremiumPremium
Animation of digital data processing over african american woman using laptop
PremiumPremium
Animation of social media icons floating over two spinning round scanners against blue background
PremiumPremiumGenerated by AI
Animation of statistical data processing against diverse man and woman discussing at office
PremiumPremiumGenerated by AI
Colleagues leaning over charts, pointing segment, circling data as finance metrics updating
PremiumPremium
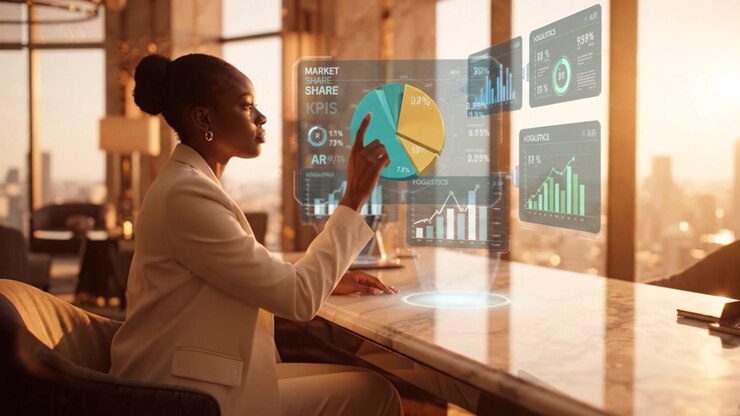
A Businesswoman Analyzes Market Data and Insights with Holographic Displays in a Modern High-Rise Office at Sunset, Symbolizing Innovation and Technology Integration
PremiumPremiumGenerated by AI
Animation of processing circles and graph on navy background
PremiumPremiumGenerated by AI
Animated Computer Monitor Displaying Growing Financial Bar Chart
PremiumPremium
Adult African woman tracking desk monitor leaning analyzing chart in specs and pink top, copy space
PremiumPremium
Animation of futuristic digital interface with clock, graphs, and circular patterns
PremiumPremiumGenerated by AI
Creative visual of business people in a corporate staff meeting on video call
PremiumPremium
Business Meeting with Interactive Data Display
PremiumPremium
Animation of text with globe and network of connections
PremiumPremium
A person engaging with data analytics on a laptop, visualizing complex graphs and metrics through an interactive interface, in a modern workspace environment
PremiumPremiumGenerated by AI
Animation of scopes scanning and data processing on digital screen
PremiumPremiumGenerated by AI
Innovative Data Interaction: A User Manipulates Digital Analytics in a Virtual Interface Displaying Charts, Graphs, and Statistical Metrics on a Laptop Screen
PremiumPremiumGenerated by AI
Animation of circles with diagrams over landscape
PremiumPremiumGenerated by AI
Vertical video: HUD animating, yellow bar moving, charts spinning and rings pulsing, showing data
PremiumPremium
Animated Gear, Bar Chart, and Line Graph Icon
PremiumPremium
Animated Data Visualization Dashboard with Donut Chart and Bar Graph
PremiumPremium
Vertical video: Team reaching keyboard, typing on laptop, animated charts overlaying for business
PremiumPremium
Animation of network of connections with icons over cityscape
PremiumPremiumGenerated by AI
Animation of viewfinder over graphs and data in navy digital screen
PremiumPremiumGenerated by AI
Animation of loading circles, graphs, globe over cropped hands of man working on laptop
PremiumPremium
Grid loading initiating HUD fading while bar chart columns growing and visualizing live metrics
PremiumPremium
Pie chart animation over digital data and code on blue background
PremiumPremiumGenerated by AI
Animated Circular Progress Chart and Bar Graph Visualization
PremiumPremium
Animated Concept of Idea Generation, Data Analysis, and Business Goals
PremiumPremium
Animation of processing circles and graph on navy background
PremiumPremium
Animation of data processing and diagrams over empty office
PremiumPremiumGenerated by AI
Animation of network of connections on blue background
PremiumPremiumGenerated by AI
Animation of digital data processing over screens on dark background
PremiumPremium
Creative visual of business data analyzing technology
PremiumPremium
Businessman Analyzing Financial Data on Computer in Office
PremiumPremiumGenerated by AI
Laptop Displaying Futuristic Financial Data Dashboard
PremiumPremiumGenerated by AI
Animated Illustration of Data Analytics Dashboard with Charts and Graphs
PremiumPremium
Exploring the Future of Digital Transactions: An In-Depth Look at Virtual Receipts, Financial Dashboards, and Secure Payment Methods in Personal Finance Management
PremiumPremiumGenerated by AI