Progress report videos

- Page 8
Animated Bar Chart Showing Global 10-Year Bond Yields Over Time
PremiumPremium
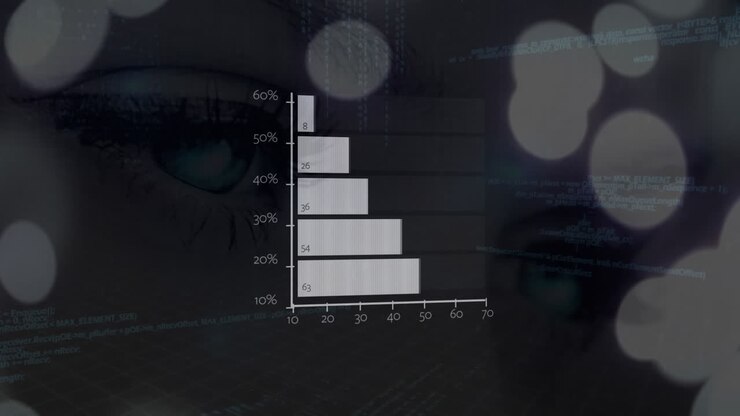
Animation of data processing over office
PremiumPremiumGenerated by AI
Businessman analyzing data on a tablet
PremiumPremium
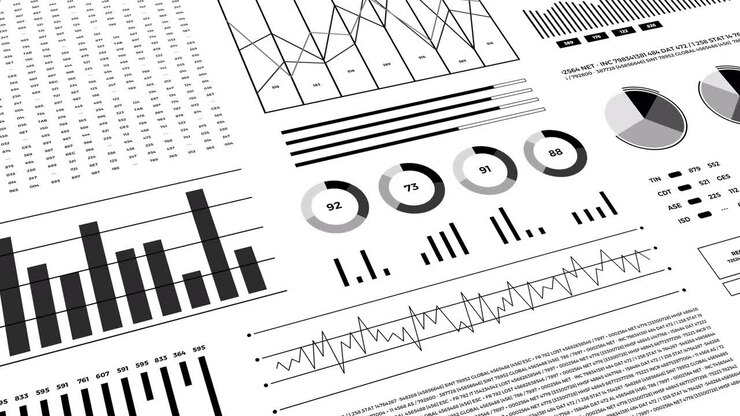
Statistics, financial market data, analysis and reports, numbers and graphs. Loopable animated opening video.
PremiumPremium
Animation of statistics and data processing
PremiumPremiumGenerated by AI
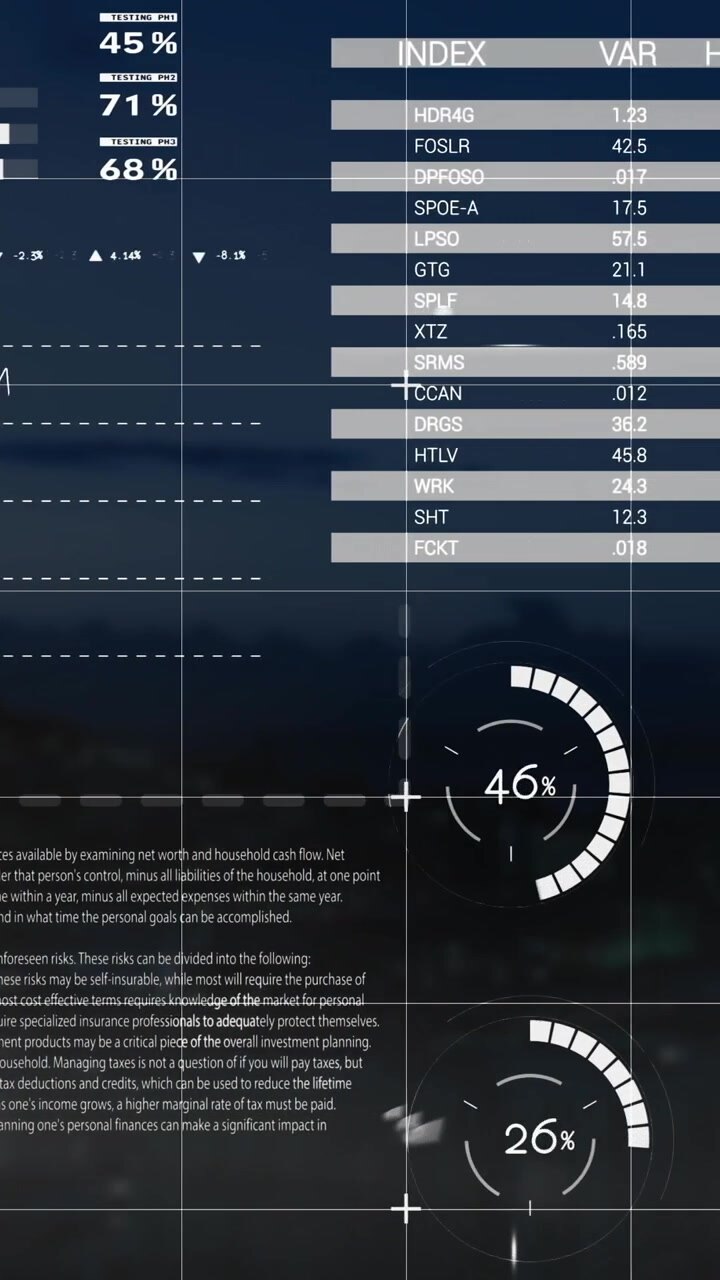
Animation of graph over data processing on black background
PremiumPremiumGenerated by AI
ANNUAL REPORT DISPLAYING ON A TABLET SCREEN
PremiumPremium
Animation of data processing over clouds
PremiumPremiumGenerated by AI
Animation of financial data processing over caucasian businesswoman writing
PremiumPremium
Person Using Tablet to Analyze Graphs
PremiumPremium
Animation of data processing over caucasian woman with coach at gym
PremiumPremiumGenerated by AI
Animation of statistical data processing against time-lapse of city traffic at night
PremiumPremiumGenerated by AI
Animation of financial data processing over cityscape
PremiumPremiumGenerated by AI
Tablet screen, graphs and planning hands of man
PremiumPremium
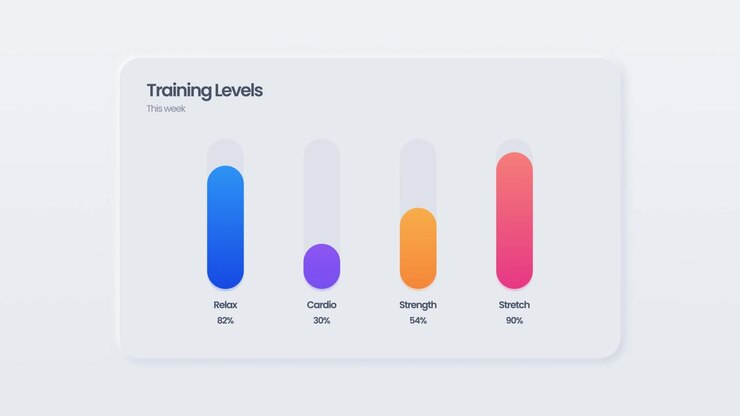
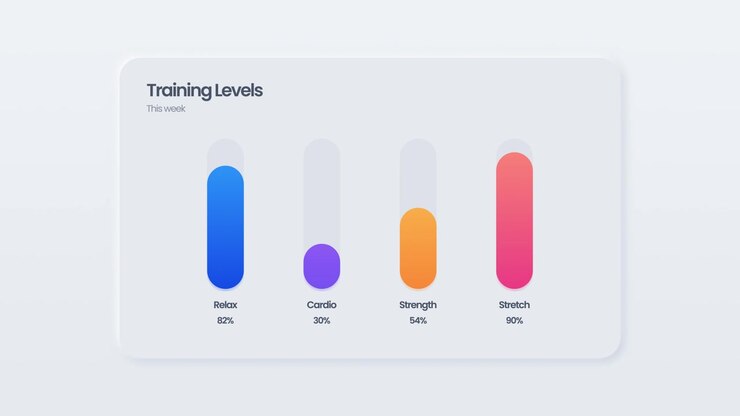
Neumorphic Capsule Level Meters
PremiumPremium
Soft UI Training Levels Vertical Bars
PremiumPremium
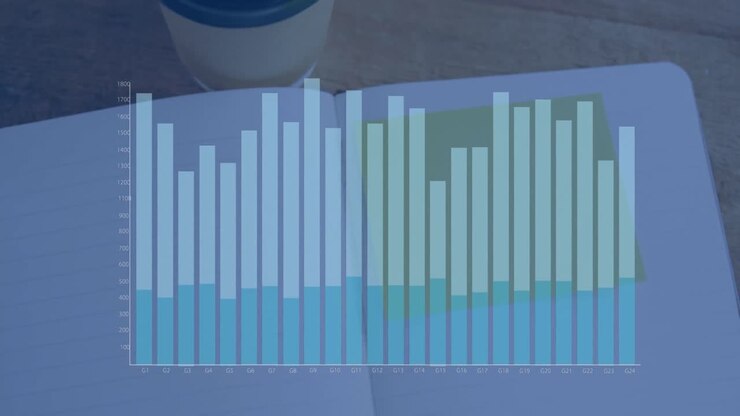
Animation of financial graph over notebook on desk
PremiumPremiumGenerated by AI
Focused Analysis of Cyber Vulnerabilities by a Security Analyst in a Modern Office Environment, Analyzing Data on a Computer Screen Showing Charts and Graphs
PremiumPremiumGenerated by AI
Animation of data processing over cityscape
PremiumPremiumGenerated by AI
Woman leaning and showing paper to laptop, seated man typing while reviewing business overlay chart
PremiumPremium
progesterone Level animation
PremiumPremium
On play blue overlay animating over beach rings updating pie rotating bars extending to show trends
PremiumPremium
Animation of graph over data processing on black background
PremiumPremiumGenerated by AI
Animation of financial data processing on blue background
PremiumPremiumGenerated by AI
Overlaying financial data charts and graphs on animation of world map and landscape
PremiumPremium
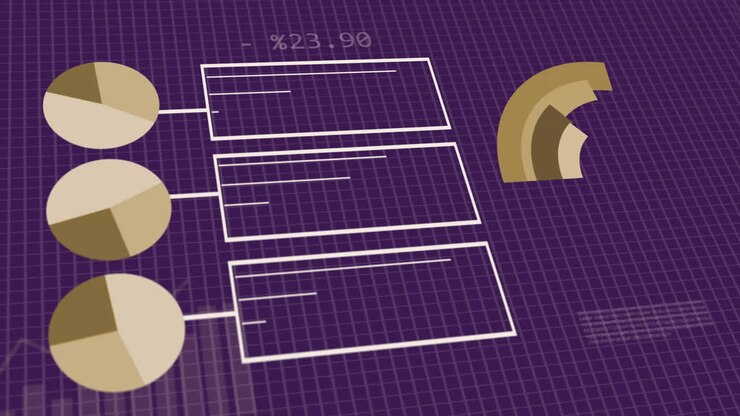
Animation of statistics and data processing over purple background
PremiumPremium
Behind every great business is a great accountant
PremiumPremium
Animation of statistical data processing against blue gradient background
PremiumPremiumGenerated by AI
Animation of statistical data processing against blue gradient background
PremiumPremiumGenerated by AI
Woman standing left and shifting while data-collecting overlay animating over her, bars rising
PremiumPremium
Animation of financial data processing on purple background
PremiumPremiumGenerated by AI
statistics pie infographic document animation
PremiumPremium
Animation of digital data processing over computer screens
PremiumPremium
Annual Energy Consumption Chart
PremiumPremiumGenerated by AI
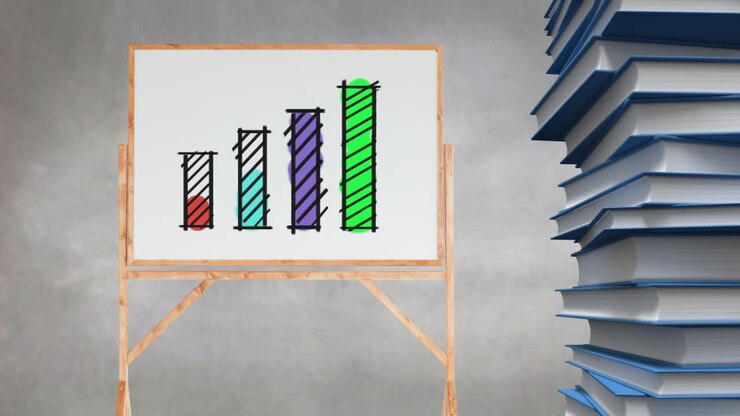
Bar graph drawing on blank canvas beside stack of books
PremiumPremiumGenerated by AI
Animation of financial data processing over cityscape
PremiumPremiumGenerated by AI
Animation of computer language and graph over computers
PremiumPremiumGenerated by AI
Animation of data processing on white background
PremiumPremium
Animation of data processing over network of connections
PremiumPremium
HUD appearing on ramp male skater entering and riding overlays updating tracking sports motion data
PremiumPremium
Animation of graphs and financial data over moving tunnel
PremiumPremium
Reviewing documents, business team analyzing data with animation overlay in office
PremiumPremium
Businessman tapping smartphone and revealing AR finance dashboard with refining bar charts and map
PremiumPremium
Animating central chart on grid, live data updating boxplots and teal purple lines
PremiumPremiumGenerated by AI
Statistics, financial market data, analysis and reports, numbers and graphs. Loopable animated opening video.
PremiumPremium
Animation of statistical data processing against orange gradient background
PremiumPremiumGenerated by AI
Bar chart showing monthly data over circuit board animation
PremiumPremium
Student writing on chalkboard and activating graphs, percentage gauges and pie charts for education
PremiumPremium
Animation of multiple graphs with data over modern cityscape against cloudy sky
PremiumPremium
Person analyzing data on a tablet
PremiumPremium