Charting videos

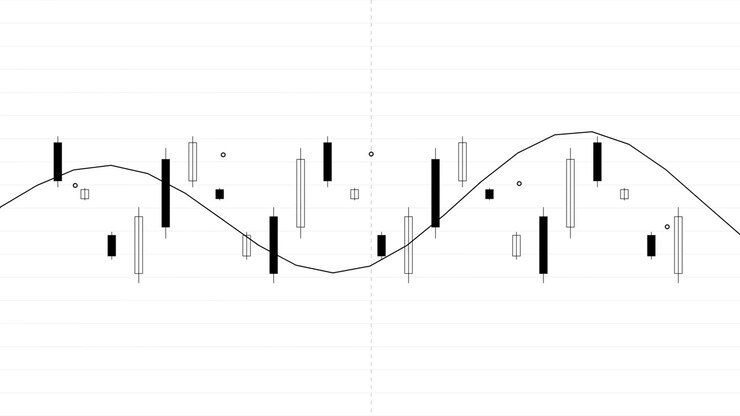
Animated Financial Candlestick Chart with Sine Wave Overlay
PremiumPremiumGenerated by AI
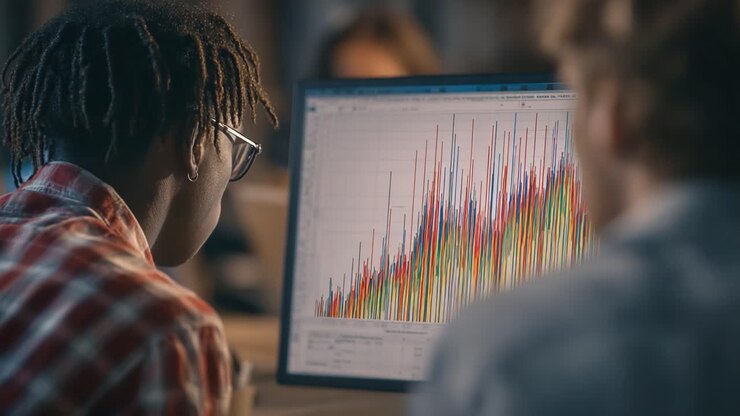
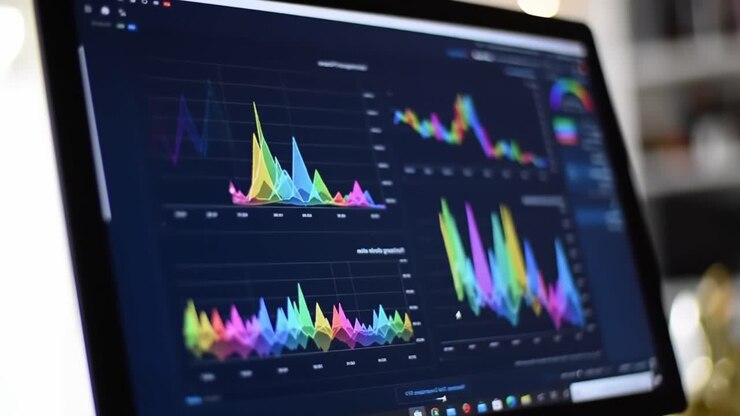
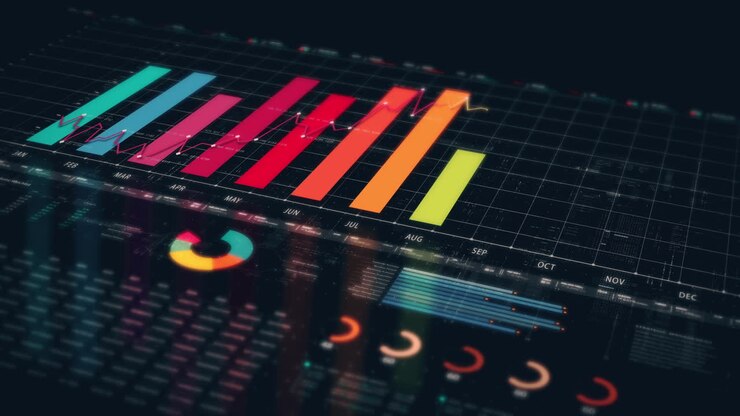
Analyzing Data Trends: A Deep Dive into Graphical Representations Displaying Colorful Metrics and Insights for Data-Driven Decision Making in Modern Analytics
PremiumPremiumGenerated by AI
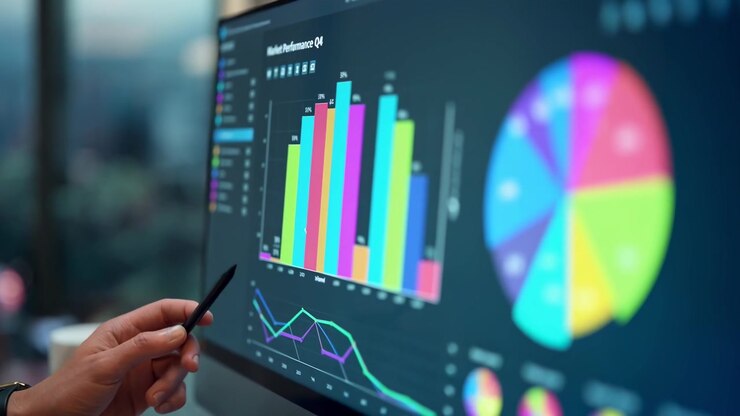
Business Analyst Reviewing Market Performance Data on Computer Screen
PremiumPremiumGenerated by AI
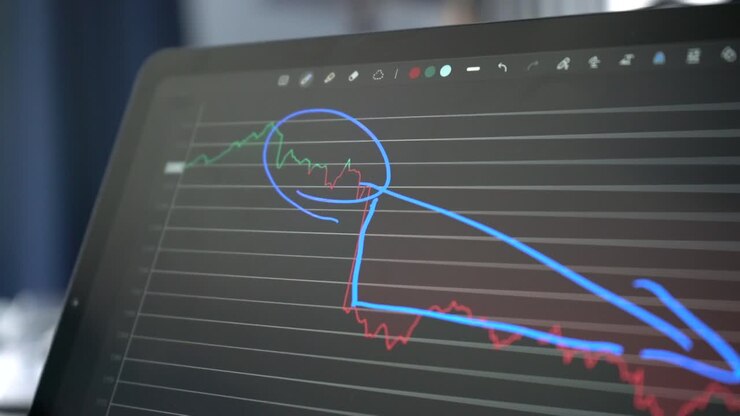
Analysis of Cryptocurrency Market Trends and Projections Through Visual Data Representation in a Whiteboard Presentation Format
PremiumPremiumGenerated by AI
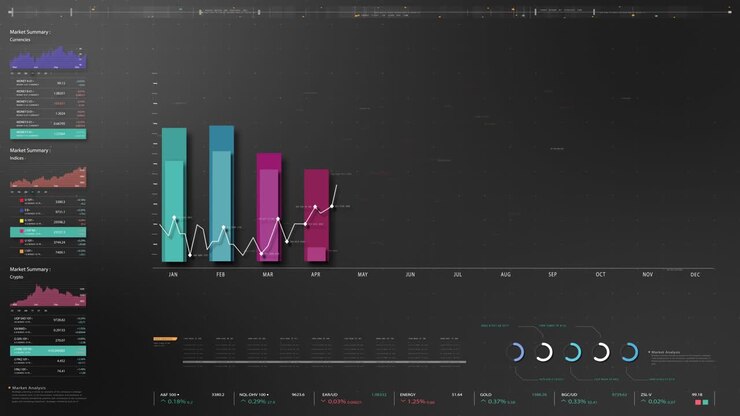
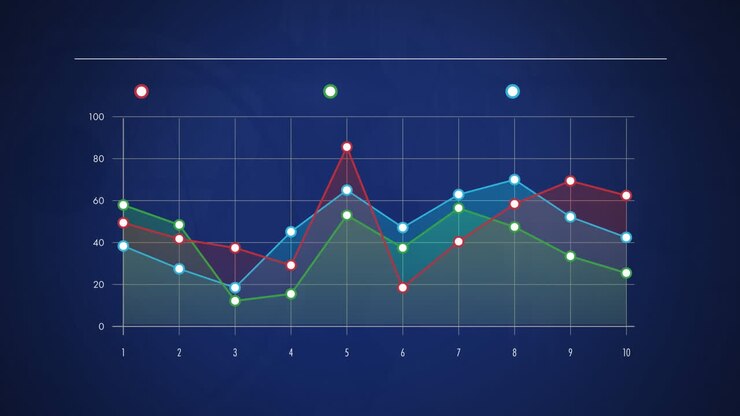
Multi-line chart starting frame 5 color lines sweeping white trace spiking marker tracking insights
PremiumPremium
African American businessman looks business report with chart company indicators
PremiumPremium
young business students working together on financial project brainstorming ideas planning market strategy using whiteboard collaborating in office workplace
PremiumPremium
Designer Using Digital Tools and Stylus on Touchscreen Monitor
PremiumPremiumGenerated by AI
Business Infographic Screen Mock up Presentation
PremiumPremium
Close up view of male hand with marker pointing to flipchart in modern office
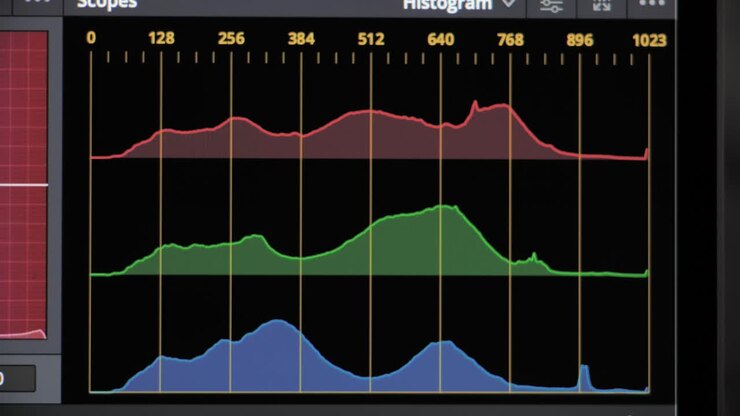
Histogram color grading software. RGB graph
PremiumPremium
Line Graph Data Visualization
PremiumPremium
Animation of statistics, connections and data processing
PremiumPremiumGenerated by AI
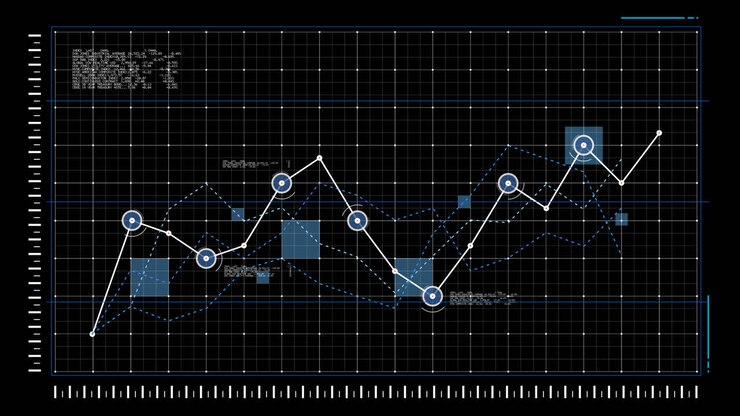
Digital presentation of lines graphs
PremiumPremiumGenerated by AI
Price predictions for crypto currency stock market crash, investment chart graph
PremiumPremium
Corporate analysis marketing
Digital presentation of lines graphs
PremiumPremiumGenerated by AI
Analysis in Action: Individuals Observing Data Visualizations on Multiple Monitors in a Modern Workspace Focused on Team Collaboration and Insight Generation
PremiumPremiumGenerated by AI
Animation of statistics, connections and data processing
PremiumPremiumGenerated by AI
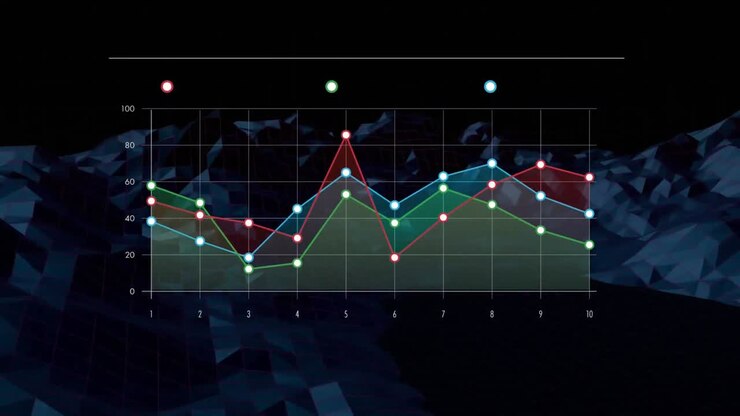
Line graphs with different colours
PremiumPremiumGenerated by AI
Line graphs with different colours
PremiumPremiumGenerated by AI
close up of a woman hands explains how to trade on the exchange
PremiumPremium
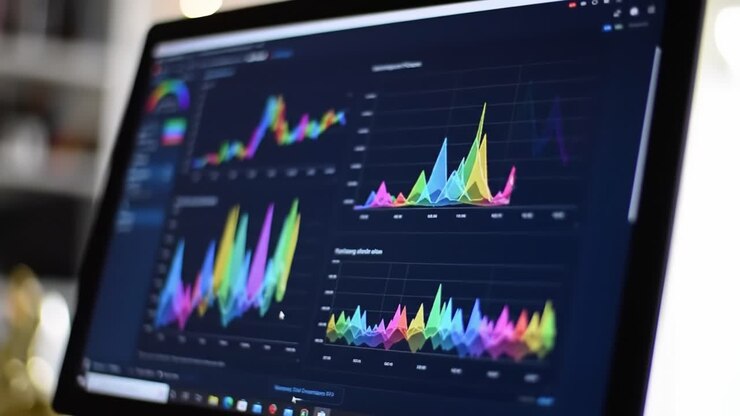
Dynamic Visualization of Data Trends: A Colorful Graphical Analysis Displaying Statistical Insights Across Various Metrics and Timeframes on a Computer Screen
PremiumPremiumGenerated by AI
Business Data Concept Graphs With Alpha 02
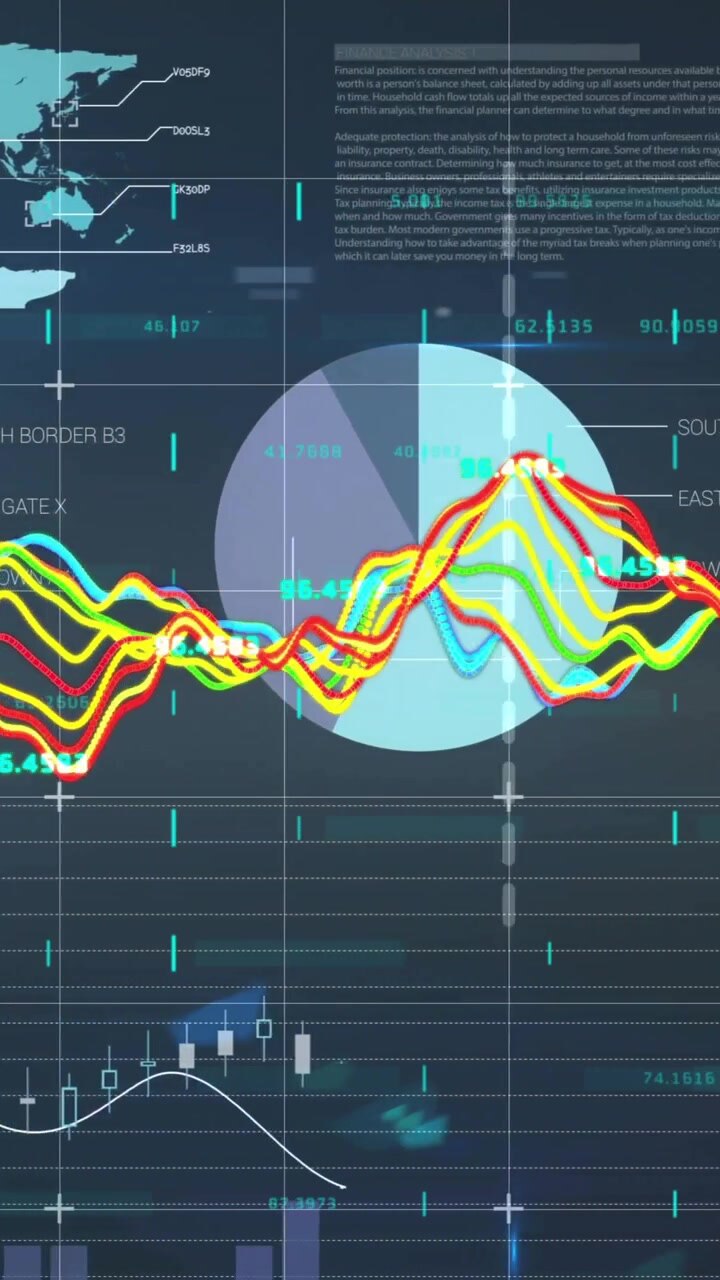
Animation of colorful financial graphs and data charts on world map statistics
PremiumPremium
Dynamic Visualization of Multicolored Data Trends: An Analytical Overview of Graphical Representations of Time Series with Color-Coded Variations
PremiumPremiumGenerated by AI
Analyzing Data Trends: A Close-Up View of Touching Colorful Graphs and Charts for Effective Insights and Decision-Making in Business Analysis
PremiumPremiumGenerated by AI
Thermo Transfer / Gaps - Data Analysis Chart
PremiumPremiumGenerated by AI
After dark grey plane forming green blue yellow bars growing shifting right visualizing data trends
PremiumPremium
Video editing
PremiumPremium
Animation of statistical data processing over grid network against blue background
PremiumPremium
Close up of hand of young succesful man writing on the economy statistics
PremiumPremium
On load, data panel animating bars, updating counters and weaving trend lines to display live data
PremiumPremium
Trader looking at digital and drawn stock market charts.
PremiumPremium
Animation of 3D bar graph and line charts on gray background with numbers
PremiumPremiumGenerated by AI
Dynamic data visuals for business info graphics, animated charts, and data-driven insights for a business meeting mock-up
PremiumPremium
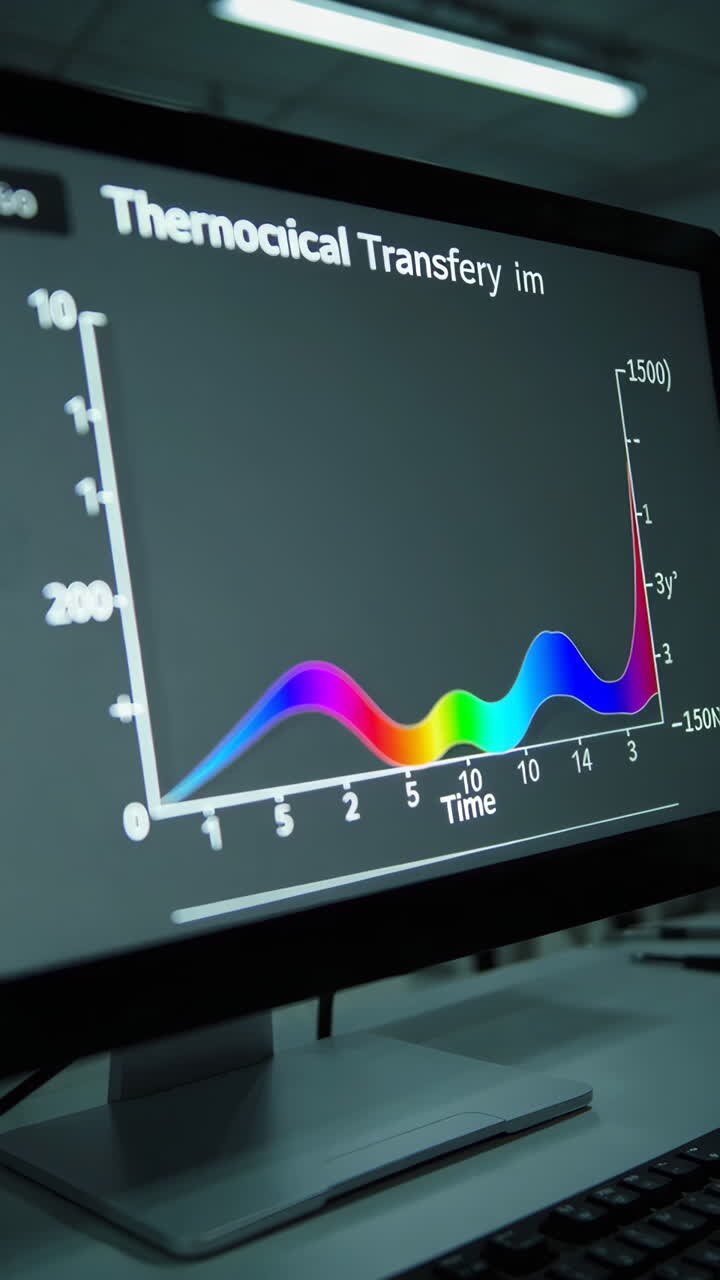
Computer Screen Showing a Thermo-Chemical Transfer Graph
PremiumPremiumGenerated by AI
Coloured graph on dark blue rotating landscape
PremiumPremiumGenerated by AI
Coloured graph on dark blue rotating landscape
PremiumPremiumGenerated by AI
Dynamic data visuals for business info graphics, animated charts, and data-driven insights for a business meeting mock-up
PremiumPremium
Young business people discussing on white board
Dynamic data visuals for business info graphics, animated 3D charts, and data-driven insights for a business meeting mock-up. Explore the world of trading, stock exchanges, and crypto
PremiumPremium
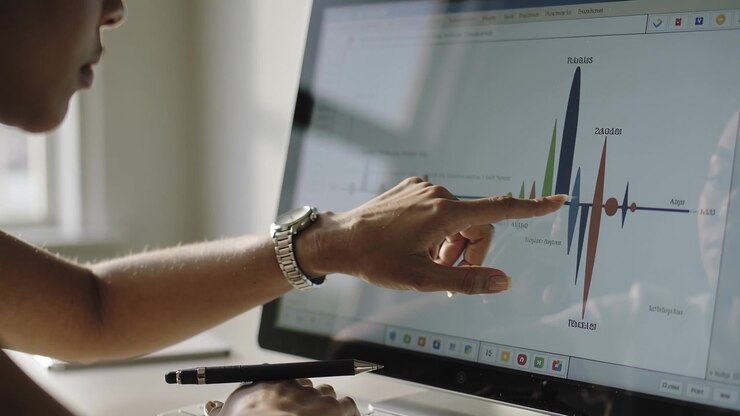
Professional Woman Analyzing Data Charts on Touchscreen Monitor
PremiumPremiumGenerated by AI
Vertical video: Stylus entering analyst tapping tablet at cafe, checking Chinese points
PremiumPremiumGenerated by AI
Animation of graphs and statistics
PremiumPremium
Animation of statistics, networks of connections and data processing
PremiumPremiumGenerated by AI
Business Infographic Screen Mock up Presentation
PremiumPremium
Vertical video: Approaching chart, hand using pen tracing donuts on tablet at desk, showing trend
PremiumPremiumGenerated by AI
Graphic Designer Working on Digital Tablet in Modern Office
PremiumPremiumGenerated by AI
Dynamic data visuals for business info graphics, animated charts, and data-driven insights for a business meeting mock-up. Explore the world of trading, stock exchanges, and crypto
PremiumPremium