Charting videos

- Page 2
Animation of graphs and statistics
PremiumPremium
Animation of statistics, networks of connections and data processing
PremiumPremiumGenerated by AI
Business Infographic Screen Mock up Presentation
PremiumPremium
Vertical video: Approaching chart, hand using pen tracing donuts on tablet at desk, showing trend
PremiumPremiumGenerated by AI
Graphic Designer Working on Digital Tablet in Modern Office
PremiumPremiumGenerated by AI
Dynamic data visuals for business info graphics, animated charts, and data-driven insights for a business meeting mock-up. Explore the world of trading, stock exchanges, and crypto
PremiumPremium
Animation of multicolored graph over dots forming graphs with changing numbers on black background
PremiumPremiumGenerated by AI
Animation of globe over data processing
PremiumPremium
On animation start gray trend appearing navy, cyan lines rising crossing visualizing data shifts
PremiumPremium
Markers initiating traces, panel showing waves sweeping right, view moving out, monitoring
PremiumPremium
RGB histogram graph on monitor screen
PremiumPremium
Animated Multi-Colored Line Graph Showing Data Trends
PremiumPremium
Analyzing financial data with bar charts and line graphs on black background
PremiumPremium
Collection of animated infographic elements
PremiumPremium
Analyzing Financial Statistics.
PremiumPremium
Animation of statistics, networks of connections and data processing
PremiumPremiumGenerated by AI
Animation of multicolored graph over dots forming graphs with changing numbers on black background
PremiumPremiumGenerated by AI
close up of a woman hands explains how to trade on the exchange
PremiumPremium
Frames animating cyan chart moving then spiking above silver stylus on leather folio showing rise
PremiumPremiumGenerated by AI
Collection of animated infographic elements
PremiumPremium
Animation of financial data processing over blue lines on black background
PremiumPremiumGenerated by AI
Digital screen with a graph and asymmetrical lines
PremiumPremiumGenerated by AI
Dashboard of a professional color correction grade software for visual artist
PremiumPremium
Animation of graphs over math formulas on white background
PremiumPremiumGenerated by AI
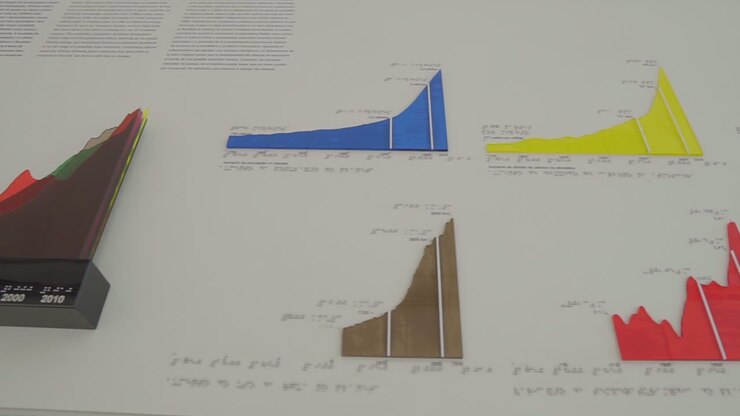
Museum of Tomorrow, Rio De Janeiro, Brazil
PremiumPremium
Abstract analytics interface showing financial volatility graph and technical indicators. Useful for fintech media, trading platforms, market analysis and economic news visuals
PremiumPremium
Animation of multicolored graphs over grid pattern against black background
PremiumPremiumGenerated by AI
Animation of triangle over graphs, map and loading bars against black background
PremiumPremiumGenerated by AI
Man hand marker pointing flip chart office. Unknown man showing graph whiteboard
PremiumPremium
Man at desk reaching for pad sorting lifting finance chart reviewing page with waveform overlay
PremiumPremium
Businessman applauding financial charts, earnings.
PremiumPremium
Digital Dashboard Displaying Financial and Operational Data Analytics
PremiumPremiumGenerated by AI
Digital screen with a graph and asymmetrical lines
PremiumPremiumGenerated by AI
Digital Financial Data Graph Overlay on Blurred City Night Background
PremiumPremium
Macro hand marker pointing flip chart office. Coach training team boardroom
PremiumPremium
Animation of statistics and data processing over colorful arrows and circles
PremiumPremium
Dynamic data visuals for business info graphics, animated charts, and data-driven insights for a business meeting mock-up. Explore the world of trading, stock exchanges, and crypto
PremiumPremium
Analyzing Data Trends: A Close-Up on Graphical Representations of Numerical Information, Showing a Hand Interacting with Colorful Data Charts in a Business Context
PremiumPremiumGenerated by AI
Animation of statistical data processing and topography against purple background
PremiumPremiumGenerated by AI
Animation of data processing against african american woman writing on whiteboard at office
PremiumPremium
Business Intelligence Screen Showing Sales Performance Charts And Colorful Metrics
PremiumPremiumGenerated by AI
Animation of statistical data processing and topography against purple background
PremiumPremiumGenerated by AI
Animation of diagrams with numbers and data processing on white background
PremiumPremiumGenerated by AI
Data spike starting colored waveform rising, peaking, splitting, merging, labeling for analytics
PremiumPremium
Rotation of the handle on the blue graph. Business background
PremiumPremium
Business Infographic Screen Mock up Presentation
PremiumPremium
Animation of financial data processing over statistics
PremiumPremium
Digital Financial Data Visualization with Animated Bar Charts
PremiumPremium
Woman Analyzing Data on Tablet
PremiumPremium