Charting videos

- Page 3
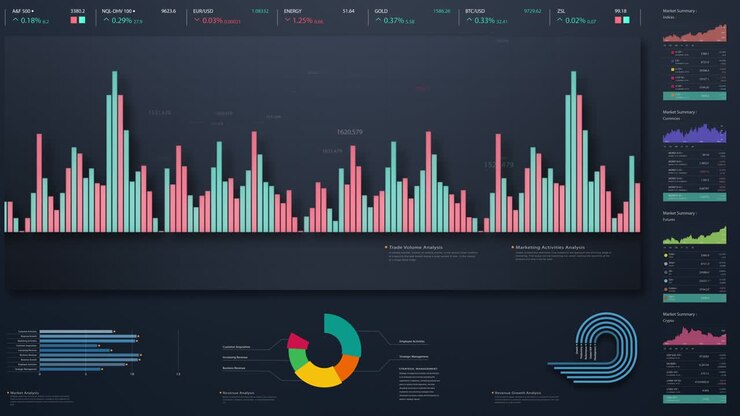
Business Infographic Screen Mock up Presentation
PremiumPremium
Animation of financial data processing over statistics
PremiumPremium
Digital Financial Data Visualization with Animated Bar Charts
PremiumPremium
Woman Analyzing Data on Tablet
PremiumPremium
Pointing hand entering from left, checking rising trend on tablet at desk, holding folio case
PremiumPremiumGenerated by AI
Vertical video: Data hit causing dotted waves and blue grid shifting camera drifting showing data
PremiumPremium
Animation of diagrams with numbers and data processing on white background
PremiumPremiumGenerated by AI
Animation of financial data processing over grid
PremiumPremiumGenerated by AI
Animation of financial data processing over grid
PremiumPremiumGenerated by AI
Animation of data processing against african american woman writing on whiteboard at office
PremiumPremium
Animation of triangle over graphs, map and loading bars against black background
PremiumPremiumGenerated by AI
Analyzing Data Trends: A Person Examines Colorful Graphs and Charts with a Yellow Pencil Amidst Colorful Writing Instruments on a Wooden Table
PremiumPremiumGenerated by AI
Business Meeting - Analyzing Data on a Tablet
PremiumPremium
Animation of financial graphs, data and world map on black background
PremiumPremiumGenerated by AI
Animation of statistical data processing and topography against blue background
PremiumPremiumGenerated by AI
Animated Financial Stock Market Chart Showing Price Fluctuations
PremiumPremium
Colorful Financial Data Visualization
PremiumPremium
Dynamic purple trading interface displaying rising financial market trends
PremiumPremium
Animation of multicolored graphs over grid pattern against black background
PremiumPremiumGenerated by AI
Vertical Video Group of business associates preparing their forecast pitch for a discussion
PremiumPremium
Data and report statistics, animation with graph diagrams.
PremiumPremium
Animating trading chart showing candles rising and bands crossing after volume spike on dark grid
PremiumPremiumGenerated by AI
Animation of financial data processing on blue background
PremiumPremium
Animated Bar Chart and Line Graph Data Visualization
PremiumPremium
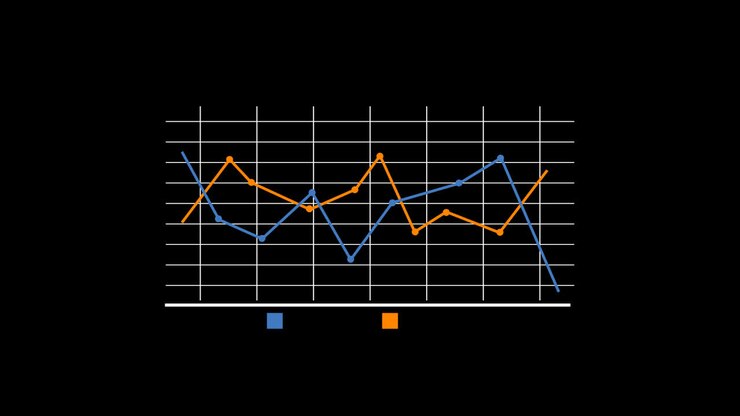
Multiple line graphs on a single grid
PremiumPremiumGenerated by AI
Close-up of businessman analyzing financial charts in company.
PremiumPremium
Wind turbine with data processing animation overlaying blue sky background
PremiumPremium
Bar and line graph animation over close-up of corn texture background
PremiumPremium
operator handling metal pen dropping then using tweezers removing module to monitor graph updating
PremiumPremium
Blue line on real time computer chart shows trend of market trading
PremiumPremium
Animated Financial Candlestick Chart with Moving Trend Line
PremiumPremium
Stock Market Chart
PremiumPremium
Animation of white infographic interface over modern cityscape against sky
PremiumPremium
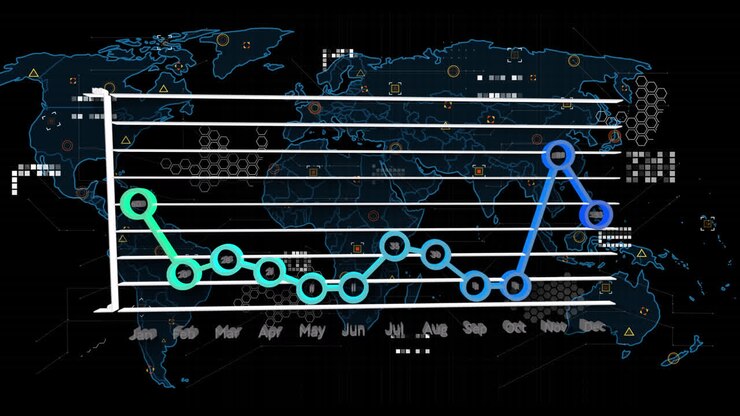
Animating line graph over digital world map background
PremiumPremium
Histogram RGB, red green blue, scope graph
PremiumPremium
Animation of data processing over diagram
PremiumPremium
Data and report statistics, animation with graph diagrams.
PremiumPremium
African american worker summarizing insights and reports on a white board
PremiumPremium
The schedule on a board. We draw a marker
PremiumPremium
Line Graphs Pack 12
PremiumPremium
Big Data - Education Infographics 66
PremiumPremium
Animation of dna and graphs over black background
PremiumPremiumGenerated by AI
Digital Financial Stock Market Chart with Fluctuating Data Trends
PremiumPremium
Analyzing Financial Data: A Close-Up of a Hand Holding a Pen While Preparing Charts and Graphs for Data Visualization and Interpretation
PremiumPremiumGenerated by AI
Creating animation of graphs and charts for data visualization on black background
PremiumPremiumGenerated by AI
Data and report statistics, animation with graph diagrams.
PremiumPremium
Animation of financial graphs, data and world map on black background
PremiumPremiumGenerated by AI
Analyzing Statistical Data: A Focus on Graphs and Charts for Enhanced Decision-Making in Business and Financial Planning
PremiumPremiumGenerated by AI
Professional Analyzing Financial Data Charts on Computer Monitor
PremiumPremium
Line graph about finances
PremiumPremiumGenerated by AI