Charting videos

- Page 5
Green bars appearing left, starting bar chart expanding and shifting, trend lines visualizing data
PremiumPremium
Writing, presentation and chart with hands
PremiumPremium
Animation of financial data processing over black background
PremiumPremiumGenerated by AI
Animation of financial data processing over dark background
PremiumPremium
Working blue-shirted worker typing on laptop at home office while data overlay growing from left
PremiumPremium
Bar cluster and cyan data band reacting to pulse, growing and oscillating, revealing trend shifts
PremiumPremium
Blue and green graph on dark blue background
PremiumPremiumGenerated by AI
Crypto investor examines financial stock trade market
PremiumPremium
First panel entering from right, panels sliding left, charts marking nodes, filling, showing trends
PremiumPremium
Initial bars rising sliding labeled bars as nodes animating before transforming rotating dashboard
PremiumPremium
Animation of data processing over black background
PremiumPremiumGenerated by AI
Vertical video: Animating candles as data updates, rising falling in 3D grid with red line labels
PremiumPremium
Animation of white colored infographic interface against abstract background
PremiumPremium
Camera panning and rotating, bars swinging and aligning over laptop, highlighting data for analysis
PremiumPremium
Network engineer typing on laptop, generating data bars and red waveform monitoring network traffic
PremiumPremium
Business Infographic Screen Mock up Presentation
PremiumPremium
Starting dotted waveform drifting, panels expanding shifting to reveal world map visualizing data
PremiumPremium
Animation of data processing over red wave
PremiumPremium
Animation of data processing on black background
PremiumPremium
Site worker tapping tablet, causing transparent chart to shift and reveal team for site planning
PremiumPremium
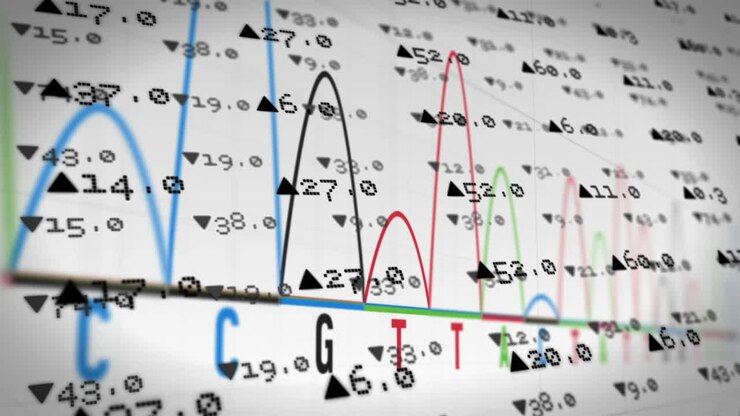
Graphs of Nucleic Acid Sequence
PremiumPremiumGenerated by AI
Animation of statistical data processing over grid network against blue background
PremiumPremiumGenerated by AI
Animation of financial data processing on white background
PremiumPremium
Thin diagonal mark initiating sweep, white trendline sweeping, bars growing and forming market wave
PremiumPremium
Fluctuating colorful lines representing data analysis animation over dark grid background
PremiumPremium
Animation of network of connections over financial data processing on black background
PremiumPremiumGenerated by AI
Animation of statistical data processing over grid network against blue background
PremiumPremiumGenerated by AI
Reading and analyzing Bitcoin charts.
PremiumPremium
Animation of statistics and financial data processing over grid on white background
PremiumPremiumGenerated by AI
Digital Financial Dashboard Displaying Real-Time Data Analytics
PremiumPremium
Animation of statistics and data processing over colorful arrows and circles
PremiumPremiumGenerated by AI
Collection of animated infographic elements
PremiumPremium
Business employee doing a presentation with project updates and timelines
PremiumPremium
Mountain landscape. We draw chalk on a board
PremiumPremium
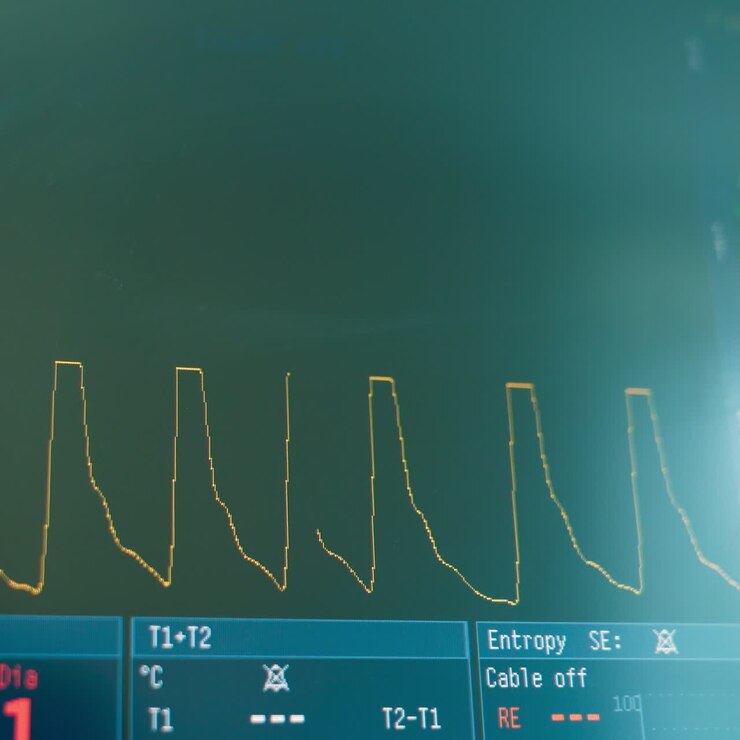
Curved line moving on the screen of modern equipment in surgery room. Screen working during operation showing life parameters
PremiumPremium
Animated Financial Growth Dashboard Displaying Rising Bar Charts Analytics Graphs And Business Performance Metrics
PremiumPremiumGenerated by AI
Animation of data processing over diagram drawings
PremiumPremiumGenerated by AI
Supervisor getting frustrated and leaving the briefing meeting,
PremiumPremium
Business stock market, trading, info graphic with animated graphs, charts and data numbers insight analysis to be shown on monitor display screen for business meeting mock up theme
PremiumPremium
Modern futuristic business finance HUD graphic graph chart, line graph report, stock exchange market analysis data financial investment concept. Loop able motion graphic
PremiumPremium
student writing graph in notebook closeup blue pen tracing plotted line on grid paper, fingertip guiding movement beside smartphone frames show problem solving, diagram sketching, notation revision
PremiumPremium
Dynamic data visuals for business info graphics, animated charts, and data-driven insights for a business meeting mock-up
PremiumPremium
Scrollbar nudging three candlestick charts up on dashboard to center view, showing colored bands
PremiumPremiumGenerated by AI
Two businessmen calculate financial expenses by looking at graphs and charts.
PremiumPremium
Updating laptop screen showing waveform and moving nodes and bars at office table, via live feed
PremiumPremiumGenerated by AI
Animation of waves and graphs on navy background
PremiumPremiumGenerated by AI
Blue and green graph on dark blue background
PremiumPremiumGenerated by AI
Animated Bar Charts Infographics for Data Presentation
PremiumPremium
Digital Data Visualization with Moving Waveform and Binary Code
PremiumPremium
Animation of data processing over diagram drawings
PremiumPremiumGenerated by AI