Charting videos

- Page 6
Blue and green graph on dark blue background
PremiumPremiumGenerated by AI
Animated Bar Charts Infographics for Data Presentation
PremiumPremium
Digital Data Visualization with Moving Waveform and Binary Code
PremiumPremium
Animation of data processing over diagram drawings
PremiumPremiumGenerated by AI
3D tech dashboard receiving data, white line spiking, bars varying, donut expanding for monitoring
PremiumPremium
On data spike colorful waveform syncing into peak green labels showing bokeh drifting for analysis
PremiumPremium
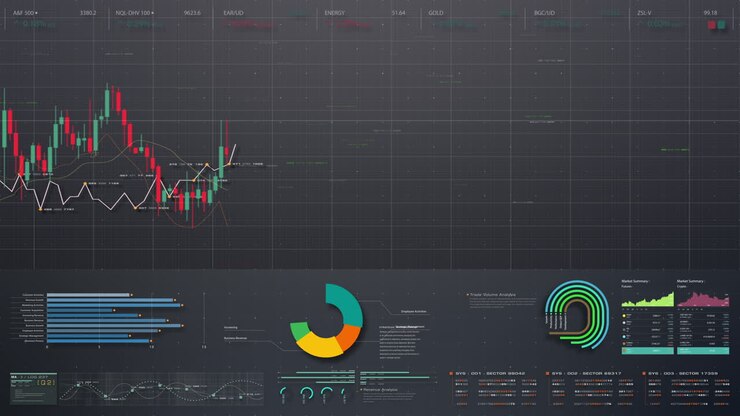
Business stock market, trading, info graphic with animated graphs, charts and data numbers insight analysis to be shown on monitor display screen for business meeting mock up theme
PremiumPremium
Business chart and graph on a white background.
PremiumPremium
Analyzing Financial Trends Through Visual Data: A Close-Up View of Stock Market Charts on a Tablet Surrounded by Organized Study Notes and Tools
PremiumPremiumGenerated by AI
Animating neon-blue line chart with y-axis labels, frames playing in HUD, rings marking trend zones
PremiumPremiumGenerated by AI
Businessman getting stressed, dissatisfied with financial statement results.
PremiumPremium
At first second data chart showing gold bars, teal cyan clusters growing, white red lines tracing
PremiumPremium
blue financial panel being shown in 3D render, featuring green bars, candlesticks, line graphs
PremiumPremium
Animation of statistical data processing against grey textured background
PremiumPremiumGenerated by AI
Vertical video: Entering right hand dragging charts on screen reviewing data in office, copy space
PremiumPremiumGenerated by AI
Schedule of a market index. We write with a marker
PremiumPremium
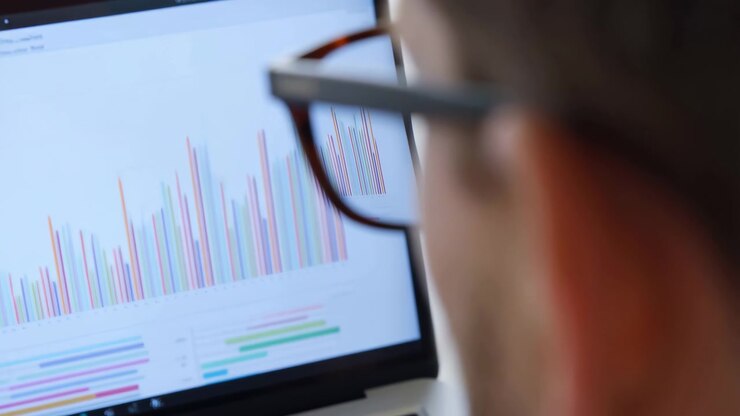
Tight over shoulder view of person wearing glasses closely reviewing laptop screen filled with grouped vertical bars, smaller horizontal charts, and clean business analytics in bright office workspace
PremiumPremiumGenerated by AI
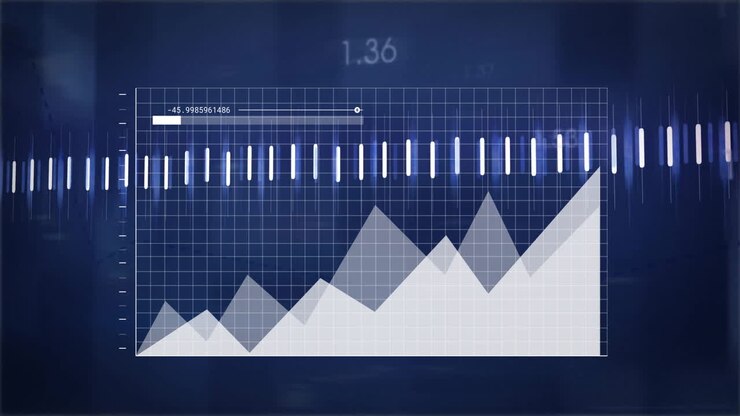
Graph with fluctuating data and sound wave animation over blue grid background
PremiumPremium
Animation of infographic interface over modern city against sky
PremiumPremium
Nurse reviewing clipboard and accepting documents while animated waveform pulsing signaling audio
PremiumPremium
Rising up diagram.Technological topographic background
PremiumPremium
Business Professional Analyzing Financial Data on a Tablet
PremiumPremiumGenerated by AI
Business chart and graph on a white background.
PremiumPremium
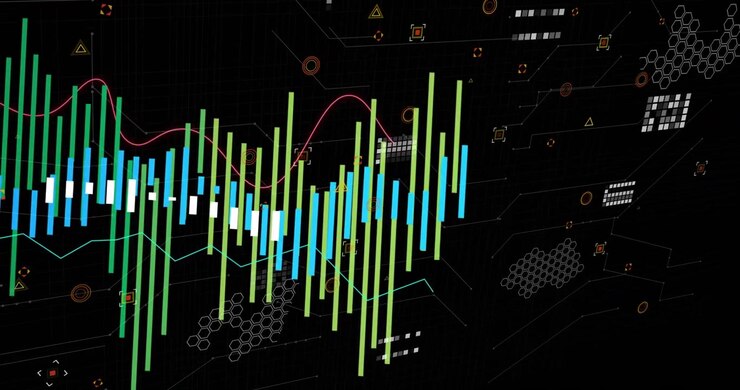
Green bars appearing left edge, blue bars emerging, lines redrawing showing data trends on hex grid
PremiumPremium
Human Hand Interacting with Financial Charts on a Digital Tablet
PremiumPremiumGenerated by AI
Bars emerging from left and shifting center, while red waveform oscillating showing data flow
PremiumPremium
Animation of financial data processing on black background
PremiumPremiumGenerated by AI
Playback starting gliding camera moving along two-row data wall on grid, revealing candlesticks
PremiumPremium
Animation of graphs and financial data over black background
PremiumPremium
woman tapping tablet edge and swiping while analyzing technology data, causing line graph rippling
PremiumPremium
Animation of financial data processing over grey background
PremiumPremiumGenerated by AI
Enterprise worker sharing her ideas for new products or services
PremiumPremium
professional business people meeting african american team leader woman sharing financial market strategy using whiteboard brainstorming colleagues collaborating in office workplace
PremiumPremium
Analyzing Data Trends Through Vibrant Visuals: A Close-Up on Hands Interacting with Graphs and Charts to Uncover Insights in Statistics and Performance Metrics
PremiumPremiumGenerated by AI
Colourful graph on a dark background moving with changing charts
PremiumPremiumGenerated by AI
Digital Financial Candlestick Chart Animation on White Background
PremiumPremiumGenerated by AI
White oscillating wave rising leftward, causing marker extending and shifting, showing data trends
PremiumPremium
Business analyst sorting pink notes, using laptop and reviewing charts with waveform running below
PremiumPremium
Data and report statistics, animation with graph diagrams.
PremiumPremium
Dynamic data visuals for business info graphics, animated 3D charts, and data-driven insights for a business meeting mock-up. Explore the world of trading, stock exchanges, and crypto
PremiumPremium
Animated Financial Candlestick Chart Displaying Market Trends
PremiumPremiumGenerated by AI
Digital animation of statistical data processing over grid network against black background
PremiumPremiumGenerated by AI
Retro Telemetry Screen Showing Signal Waveforms and Data Controls
PremiumPremium
Animation of multiple graphs with arrows and changing numbers moving over pencil and blank papers
PremiumPremiumGenerated by AI
After grid load, multicolored waveform lines expanding peaking weaving showing signal changes
PremiumPremium
Yellow baseline causing waves oscillating into peaks then rippling while representing data trends
PremiumPremium
Animated Digital Business Data Charts and Graphs
PremiumPremium
Young business people discussing financial report on white board in office.
PremiumPremium
A Focused Analysis on Data Trends: An Individual Utilizing a Pen to Annotate Graphs and Charts in a Professional Workspace, Capturing Key Insights from Reports
PremiumPremiumGenerated by AI
Digital Soccer Tactical Analysis Displaying Player Movement and Passing Strategy
PremiumPremium