Circular chart videos

- Page 3
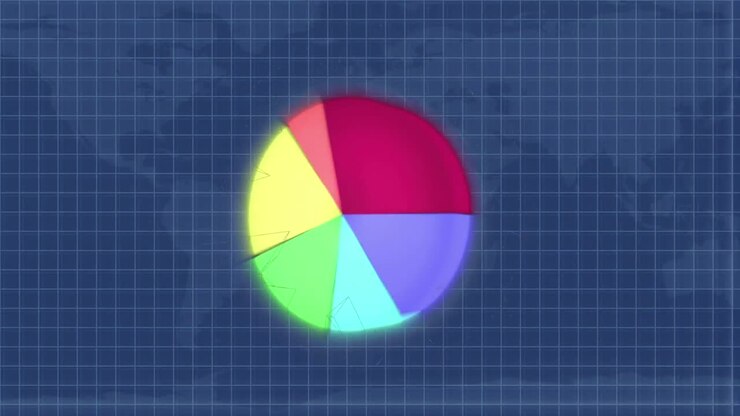
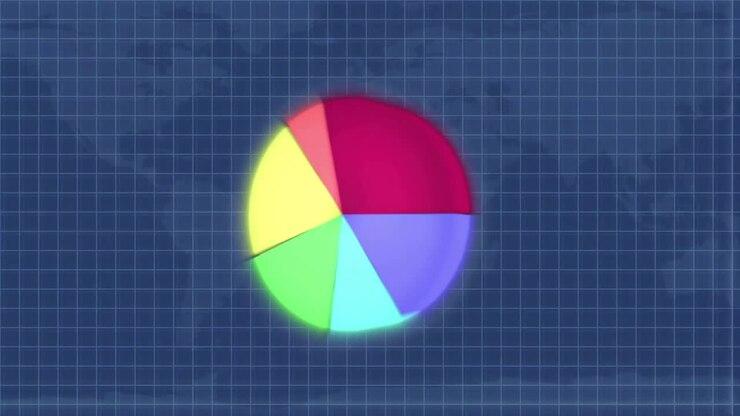
Colourful 3d pie chart
PremiumPremium
Animation of statistics and data processing on grey background
PremiumPremium
Big Data - Education Infographics 86
PremiumPremium
A Dynamic 3D Pie Chart Rotating Displaying Various Color Segments Representing Different Data Proportions and Analytical Insights in Modern Visualization Techniques
PremiumPremiumGenerated by AI
Abstract Blue Geometric Circular Shape Rotating on Dark Background
PremiumPremium
Abstract Digital HUD Interface with Rotating Geometric Elements
PremiumPremium
Abstract Geometric Circular Motion Graphic on Dark Background
PremiumPremium
Abstract Motion Graphic of Expanding and Contracting Geometric Circles
PremiumPremium
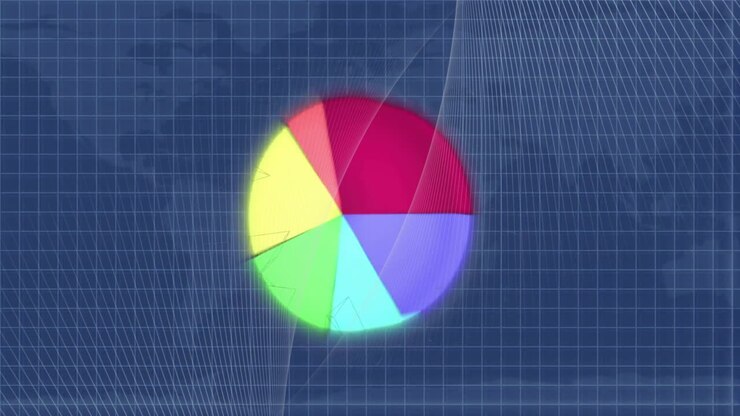
Animation of statistics and data processing over world map
PremiumPremium
Abstract Motion Graphics with Rotating Blue and Gold Shapes
PremiumPremium
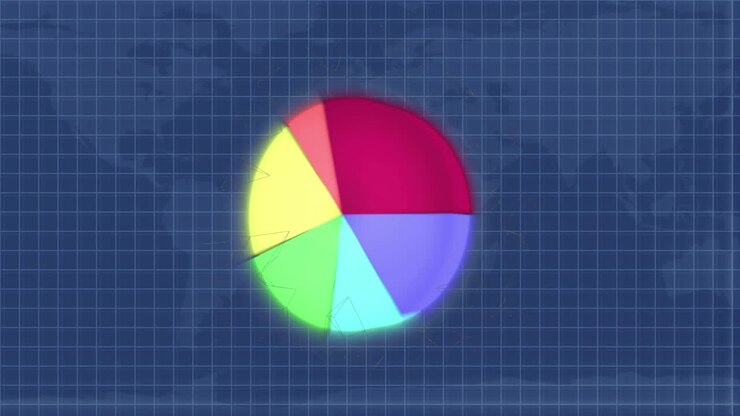
Colourful 3d pie chart
PremiumPremium
Graphic design on the right side that changes color as it rotates clockwise, composed of colorful shapes and textures, in 16: 9 video format.
PremiumPremium
2d Colorful Stroke
PremiumPremium
Animation of colorful pieces icon that are arranged around each other in a circle on black background. Indicator for loading progress. Seamless looping. Video animated background.
PremiumPremium
Chart animation.
PremiumPremium
Info graphic circle four color and radar point blink and faded
PremiumPremium
Animation of data processing over black background
PremiumPremium
Animation of statistics and data processing over world map
PremiumPremium
Soft pastel pie chart filling gently on a light cream background for clean presentation videos
PremiumPremiumGenerated by AI
An animated 3D looping donut chart with independently expanding and contracting segments. Ideal for dynamic data visualization, business presentations, and infographics. Modern, clean, and vibrant
PremiumPremium
A colorful symmetrical pattern of red, blue, green, yellow, and purple dots forming a circle against a black background in the image
PremiumPremium
Animation of statistics and financial data processing over circles
PremiumPremium
3D animation of a Xenon atom on a transparent background showing shells, subshells, electron orbits, and nucleus with protons and neutrons, illustrating atomic structure and energy levels.
PremiumPremium
Abstract Motion Graphics with Rotating Colorful Petal Shapes
PremiumPremium
Animation of data processing over black background
PremiumPremium
Animation of abstract colourful pie chart
PremiumPremium
Futuristic technology animation of animated pie chart with colorful slices for digital innovation and data stories
PremiumPremiumGenerated by AI
3D Animation of a colorful pie chart growing up
PremiumPremium
Animated graphic about growth
PremiumPremium
Animation of circle diagram and data processing over world map
PremiumPremium
Animation of statistics and financial data processing over circles
PremiumPremium
Four-Color Segmented Circular Loading Animation
PremiumPremium
Animation of graph over white background
PremiumPremium
3D animation of a Chromium atom on a transparent background showing shells, subshells, electron orbits, and nucleus with protons and neutrons, illustrating atomic structure and energy levels.
PremiumPremium
A Vibrantly Colored Pie Chart Transitioning Through Shades, Showcasing Segmented Sections in an Eye-Catching Display Against a Dark Background
PremiumPremiumGenerated by AI
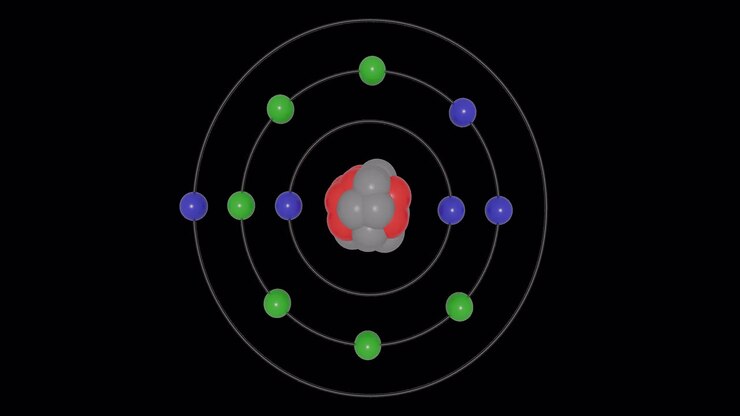
3D animation of an Sodium (Na) atom in the Bohr model with electron orbits, nucleus, protons and neutrons, energy levels in seamless loop on transparent background. Ideal for STEM education visuals
PremiumPremium
Pie chart percentages
PremiumPremium
Graphic drawings that rotate in the center changing color.
PremiumPremium
Futuristic technology animation of animated donut chart with percentage counter for digital innovation and data stories
PremiumPremiumGenerated by AI
Animation of diagram over world map on blue background
PremiumPremium
Circle graphic infographic with alpha cahnnel.Colorful circle animation
PremiumPremium
An animated 3D looping donut chart with independently expanding and contracting segments. Ideal for dynamic data visualization, business presentations, and infographics. Modern, clean, and vibrant
PremiumPremium
infographic 4K
PremiumPremium
Abstract Motion Graphic of Rotating Blue and Purple Data Bars
PremiumPremium
A set of simple, flat, animated pie charts. The graphs range from 10% to 100%.
PremiumPremium
Abstract Motion Graphic of Rotating Lines and Pulsing Data Bars
PremiumPremium
An animated 3D looping donut chart with independently expanding and contracting segments. Ideal for dynamic data visualization, business presentations, and infographics. Modern, clean, and vibrant
PremiumPremium
Animation of financial data processing over cityscape
PremiumPremium
A Vibrant and Colorful Circular Arrangement of Geometric Shapes, Showcasing a Beautiful Rainbow Spectrum with Distinct Sections that Mesmerize the Viewer
PremiumPremiumGenerated by AI
Graphic drawings that rotate in the center changing color.
PremiumPremium