Histogram videos

- Page 5
Graph and bar animation fast appear and still show information and disappear in finished
PremiumPremium
Animated Corporate Infographic Opener with Data Visualization Charts for Premiere Pro 2023 (MOGRT)
PremiumPremium
Animation of data processing over black background
PremiumPremium
Animated Financial Bar Chart and Performance Metrics Dashboard
PremiumPremiumGenerated by AI
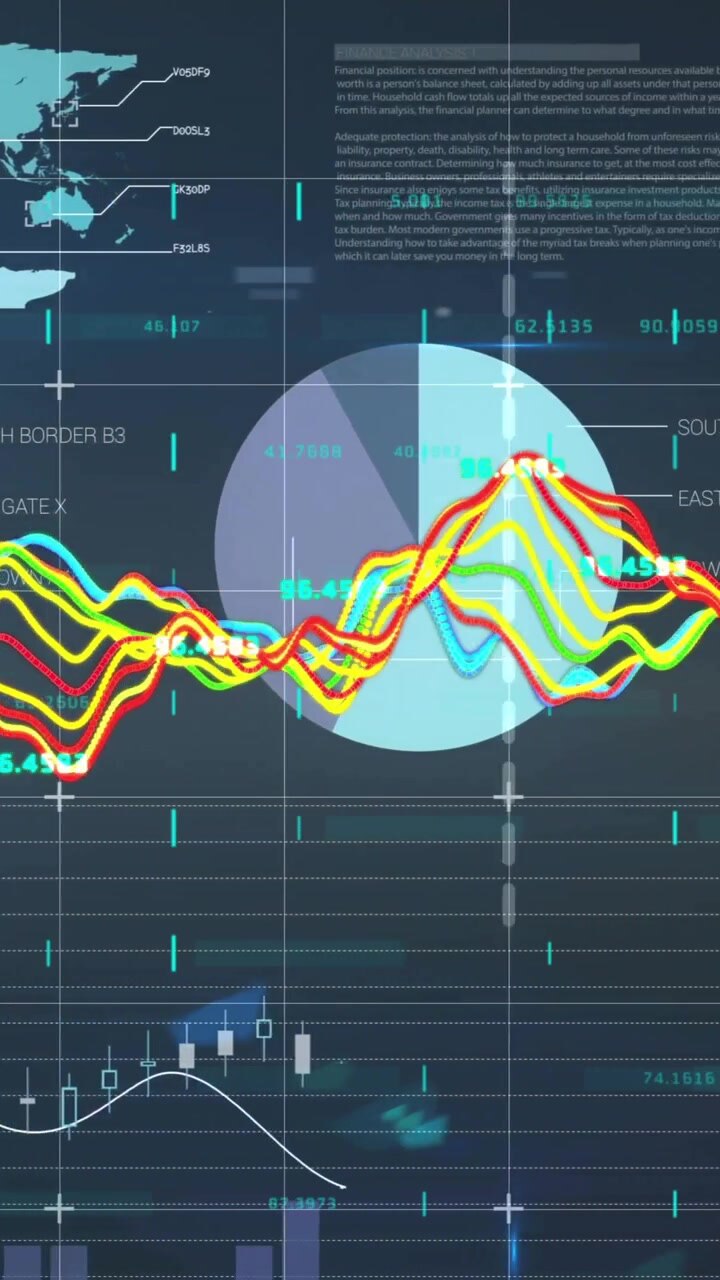
Animation of colorful financial graphs and data charts on world map statistics
PremiumPremium
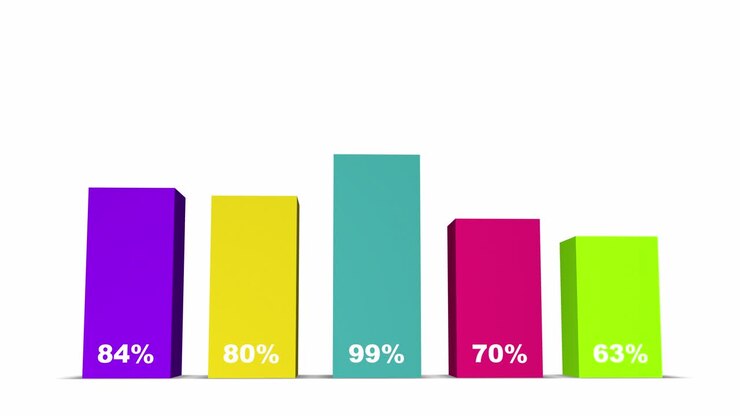
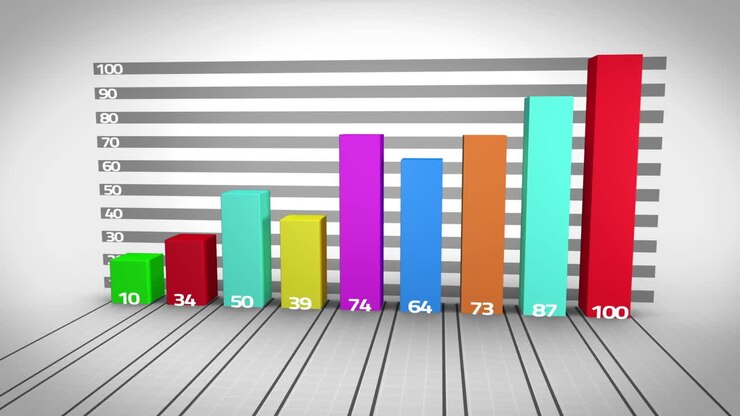
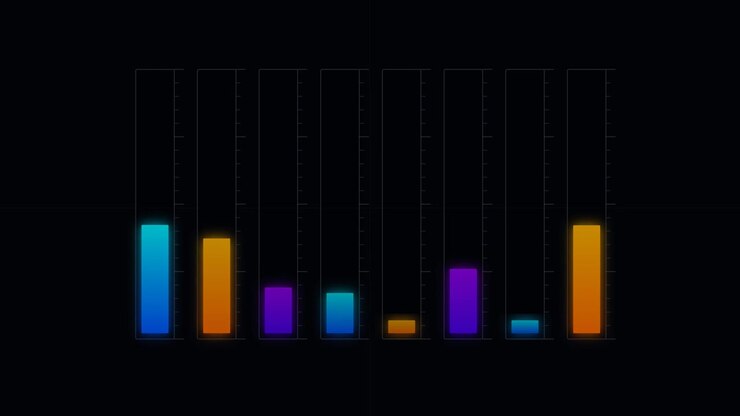
Colorful bar graph rises sequentially against a dark background to illustrate rapid market expansion
PremiumPremium
Big Data - Education Infographics 84
PremiumPremium
Area Chart
PremiumPremium
Animation of financial data processing on black background
PremiumPremium
Futuristic technology animation of animated combo bar and line chart for digital innovation and data stories
PremiumPremiumGenerated by AI
A seamless looping animation of a 3D business data visualization. The digital infographic bars represent progress and growth, perfect for professional, corporate, and technological themes
PremiumPremium
Futuristic technology animation of animated combo bar and line chart for digital innovation and data stories
PremiumPremiumGenerated by AI
Futuristic technology animation of animated grouped bar chart for digital innovation and data stories
PremiumPremiumGenerated by AI
Animation of blue diagrams and arrow over storm
PremiumPremium
A seamless looping animation of a 3D business data visualization. The digital infographic bars represent progress and growth, perfect for professional, corporate, and technological themes
PremiumPremium
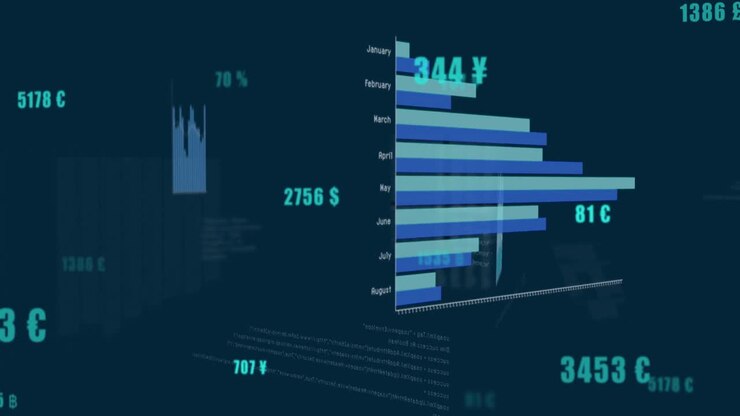
Animation of multiple changing numbers and statistical data processing against blue background
PremiumPremiumGenerated by AI
Animation of multiple changing numbers and statistical data processing against blue background
PremiumPremiumGenerated by AI
Bar graph with male and female icons and values
PremiumPremiumGenerated by AI
A colorful bar graph grows sequentially against a dark blue starry background comparing skyscraper heights
PremiumPremium
Animation of data processing over screen on dark background
PremiumPremiumGenerated by AI
Digital Interface Showing Squat Progress Tracking Graph
PremiumPremium
Digital Fitness App Interface Showing Squat Progress Chart
PremiumPremium
Animation of data processing and statistics over globe
PremiumPremiumGenerated by AI
Animated Bar Chart Showing Global Economic Rankings Over Time
PremiumPremiumGenerated by AI
Animated Bar Chart Showing Global Economic Rankings Over Time
PremiumPremiumGenerated by AI
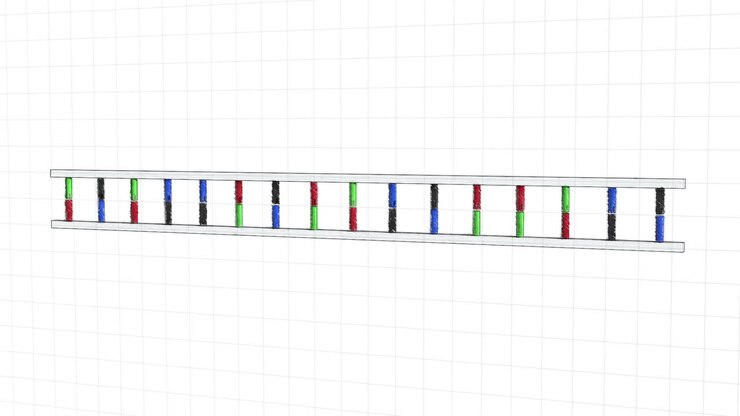
Animation of DNA moving
PremiumPremium
Corporate Infographic Comparison Chart Template with Statistics for Premiere Pro 2023 (MOGRT)
PremiumPremium
Animation of data processing over black background
PremiumPremiumGenerated by AI
Futuristic technology animation of animated horizontal bar chart with colorful bars and data labels for digital innovation and data stories
PremiumPremiumGenerated by AI
Corporate Infographics with Comparison Charts and Data Analytics for After Effects 2023
PremiumPremium
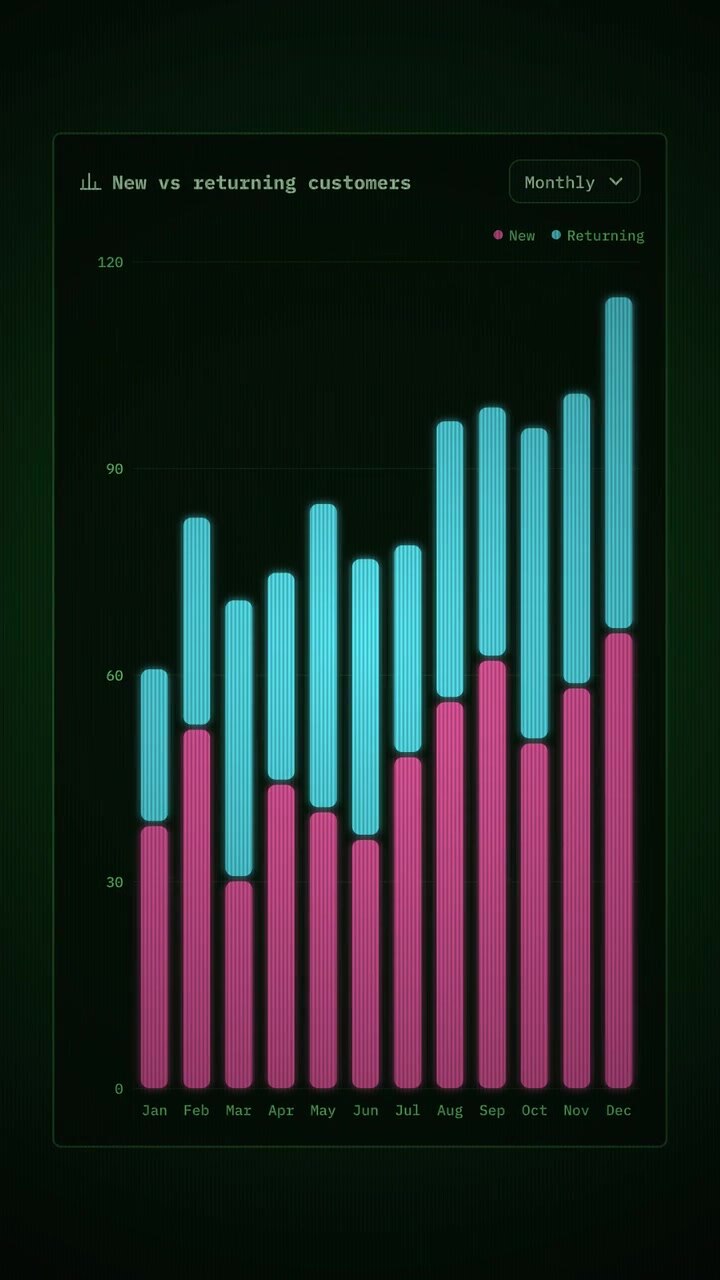
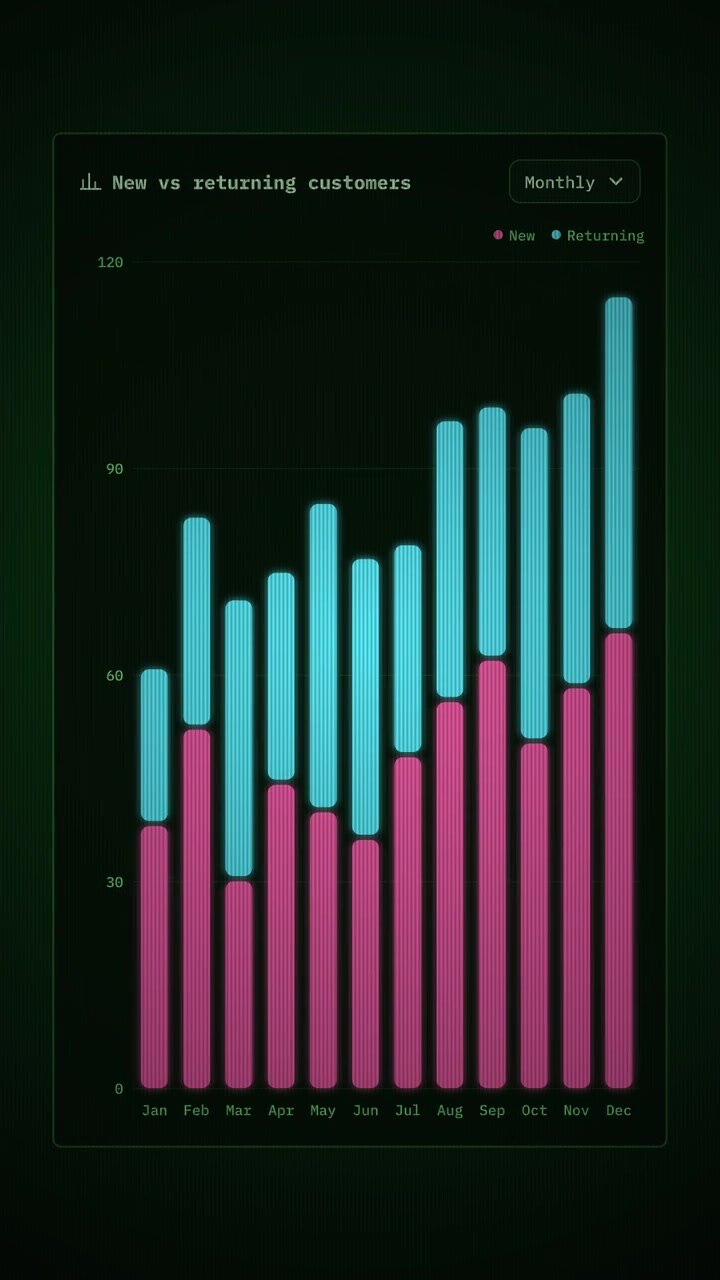
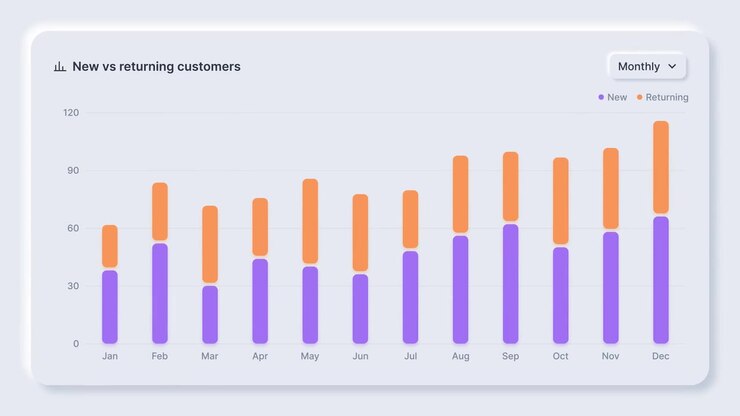
Animated Bar Chart Showing Monthly New and Returning Customers
PremiumPremium
Animated Bar Chart Showing New Versus Returning Customers
PremiumPremium
Animation of statistics and data processing over blue background
PremiumPremium
Animation of statistical data processing against grey background
PremiumPremiumGenerated by AI
Animated Bar Chart Showing Subscriber Growth Race
PremiumPremium
Animated Bar Chart Showing Subscriber Growth Race
PremiumPremium
Animation of financial data processing on black background
PremiumPremiumGenerated by AI
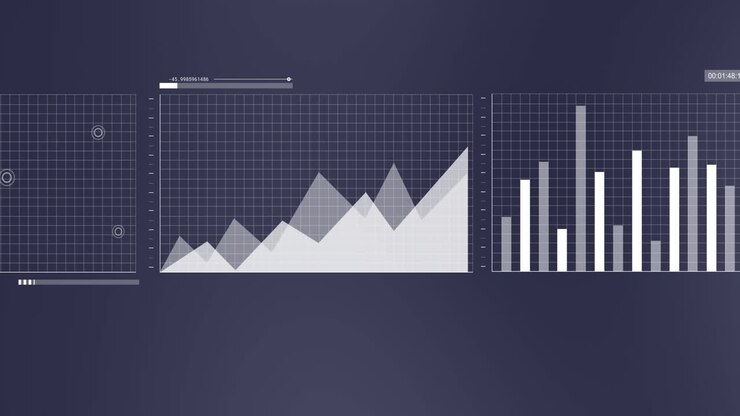
Animation of statistics and financial data processing over white background
PremiumPremiumGenerated by AI
Animation of diverse graphs and financial data on navy background
PremiumPremiumGenerated by AI
A seamless looping animation of a 3D business data visualization. The digital infographic bars represent progress and growth, perfect for professional, corporate, and technological themes
PremiumPremium
Corporate Infographic Dashboard with Finance Analytics and Charts for Premiere Pro 2023 (MOGRT)
PremiumPremium
Corporate Infographics for Analytics Dashboard and Statistics for After Effects 2023
PremiumPremium
Animated Bar Chart Showing Subscriber Growth Comparison
PremiumPremium
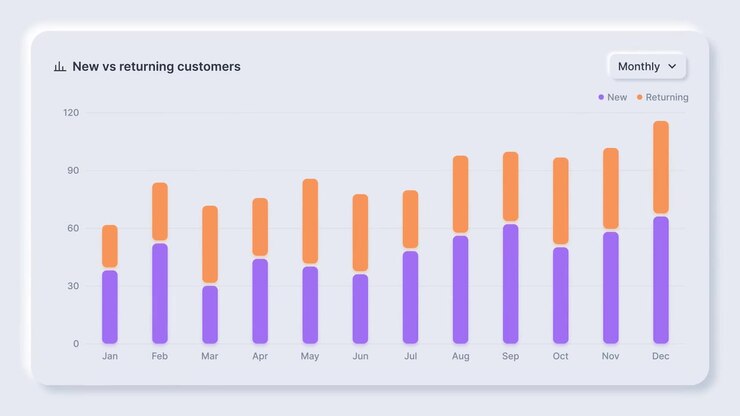
Animated Bar Chart Showing New Versus Returning Customers
PremiumPremium
Animated Bar Chart Showing New Versus Returning Customers Monthly
PremiumPremium
Animation of data processing over white spots and diagrams
PremiumPremium
Animated Bar Chart Showing Subscriber Growth Race
PremiumPremium
Animated Colorful Bar Graph Showing Data Fluctuations
PremiumPremium
Animation of data processing over black background
PremiumPremiumGenerated by AI
Blue color financial chart up arrow business graph background
PremiumPremium