Statistic videos

- Page 7
Digital dashboard interface displaying grid, area and bar charts in dark blue theme
PremiumPremium
Bar chart animating as slider moves bars shifting red scan sweeping globe rotating showing metrics
PremiumPremium
Animated pie share data chart growing on a dark business background for presentations reports and financial videos
PremiumPremiumGenerated by AI
Male and female icons with bar graph in red and blue
PremiumPremiumGenerated by AI
animation of graphics, Financial diagram and charts showing profits and losses. Elements for user interface UI, or infographics. template and graph corporate and business presentation. 3d modern style
PremiumPremium
Bars and binary codes
PremiumPremiumGenerated by AI
Animation of data processing and diagrams over empty office
PremiumPremiumGenerated by AI
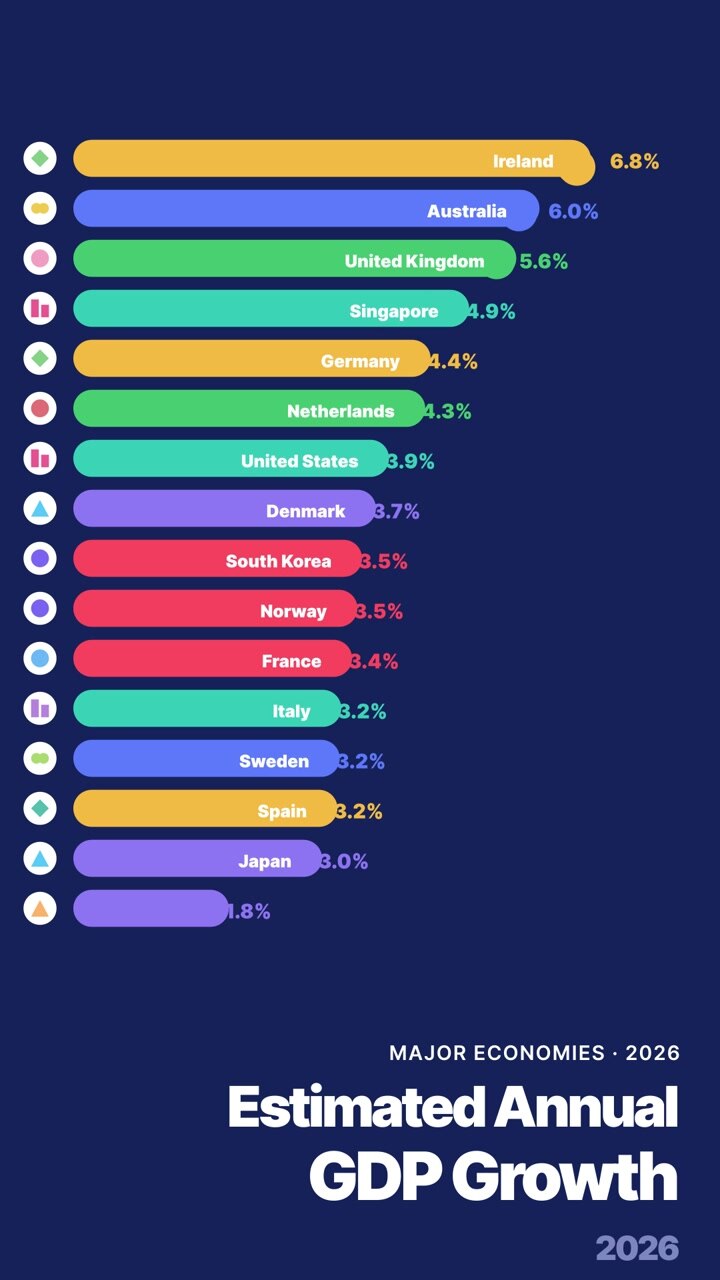
Animated Bar Chart Showing Estimated Annual GDP Growth of Major Economies
PremiumPremium
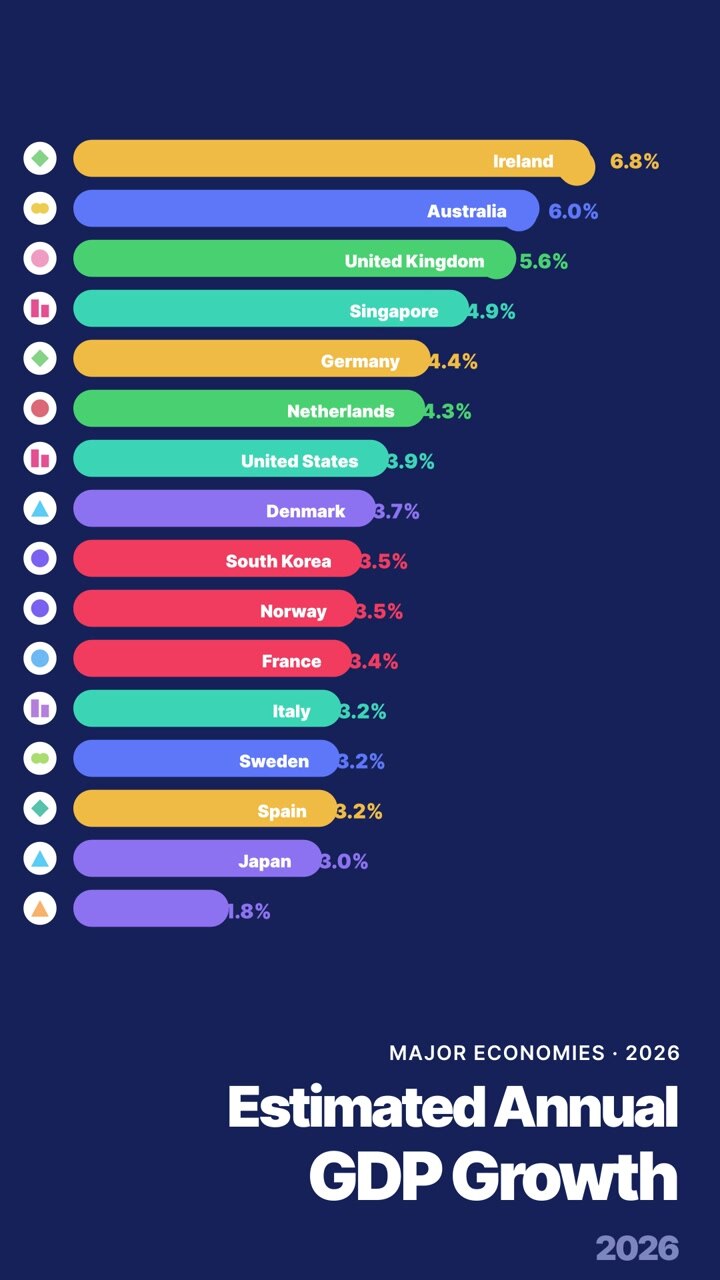
Animated Bar Chart Showing Estimated Annual GDP Growth of Major Economies
PremiumPremium
Finance, Money Graph
PremiumPremium
Animation of financial data processing on blue background
PremiumPremiumGenerated by AI
Animated Dashboard Displaying Various Financial Data Charts and Graphs
PremiumPremium
Bar Graph Data Visualization
PremiumPremium
Animation of waves and graphs on navy background
PremiumPremiumGenerated by AI
Animated pie chart building into colourful segments showing market share percentages on a clean white background
PremiumPremiumGenerated by AI
Animation of multiple graphs and loading bar with changing numbers over blue background
PremiumPremiumGenerated by AI
Digital Financial Data Dashboard with Animated Charts and Graphs
PremiumPremium
Animation Graph Growth Chart Infographic Green Screen
PremiumPremium
Futuristic technology animation of animated vertical bar chart with colorful bars and data labels for digital innovation and data stories
PremiumPremiumGenerated by AI
Animated Bar Chart Growing and Shrinking with Trend Line
PremiumPremium
Pie chart and numbers filling up with colour
PremiumPremiumGenerated by AI
Animated Bar Chart Growing and Shrinking on Blue Background
PremiumPremium
Animation of data processing over blue background
PremiumPremium
Animated Bar Chart Showing New Versus Returning Customers
PremiumPremium
Animated Bar Chart Showing New Versus Returning Customers Monthly
PremiumPremium
Animation of financial data processing over light spots on black background
PremiumPremiumGenerated by AI
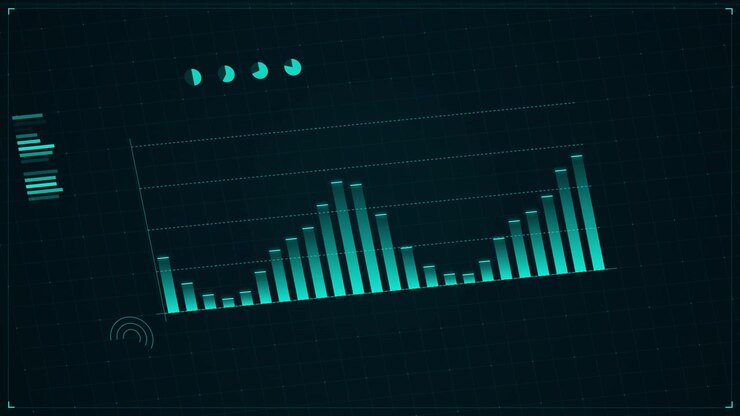
Animated Bar Chart Graphic Displaying Financial Data Growth on Dark Grid
PremiumPremium
Digital Bar Graph Data Visualization on Dark Background
PremiumPremium
Animated UI appearing initiating data points emerging line plotting waves growing dashboard forming
PremiumPremium
Animation of changing numbers with loading circles over graphs against blue background
PremiumPremiumGenerated by AI
Animation of statistics and digital data processing over dark background
PremiumPremiumGenerated by AI
Futuristic technology animation of animated stacked bar chart for digital innovation and data stories
PremiumPremiumGenerated by AI
Animated Bar Chart Showing New Versus Returning Customers
PremiumPremium
Animated Bar Chart Showing New Versus Returning Customers
PremiumPremium
Central bar chart shifting while slider moving, triangle marking right, radar rotating, analytics
PremiumPremium
Animation of multiple graphs and loading bar with changing numbers over blue background
PremiumPremium
Animated Blue Bar Chart Growing on Grid Background
PremiumPremium
Animation of multiple graphs, map, loading bar against blue background
PremiumPremiumGenerated by AI
Animation of financial data processing over dark background
PremiumPremium
Animation of financial data processing over scope scanning
PremiumPremium
Animated Bar Chart Showing Subscriber Growth Race
PremiumPremium
Animation of diverse graphs on blue background
PremiumPremiumGenerated by AI
COLLECTING DATA box appearing, blue bar-line chart growing, binary arcs sliding, visualizing growth
PremiumPremium
Animated Bar Chart Showing Subscriber Growth Race
PremiumPremium
animation of graphics, Financial diagram and charts showing profits and losses. Elements for user interface UI, or infographics. template and graph corporate and business presentation. modern style
PremiumPremium
Incoming data feed arriving, four HUD panels updating and showing live metrics with magenta frame
PremiumPremium
Animation of data processing over light spots
PremiumPremium
Blue color financial chart up arrow business graph background
PremiumPremium
Animation of blue graph processing data over business icons and globe on blue background
PremiumPremiumGenerated by AI
Male and female icons with bar graph in red and blue
PremiumPremiumGenerated by AI